By Mateusz Papiernik and Matt Abrams
Not using Ubuntu 18.04?
Choose a different version or distribution.
The author selected the Open Internet/Free Speech Fund to receive a donation as part of the Write for DOnations program.
Introduction
As a systems administrator, it’s a best practice to know the current state of your infrastructure and services. Ideally, you want to notice failing disks or application downtimes before your users do. Monitoring tools like Checkmk can help administrators detect these issues and maintain healthy servers.
Generally, monitoring software can track your servers’ hardware, uptime, and service statuses, and it can raise alerts when something goes wrong. In a very basic scenario, a monitoring system would alert you if any services go down. In a more robust one, the notifications would come shortly after any suspicious signs arose, such as increased memory usage or an abnormal amount of TCP connections.
There are many monitoring solutions available offering varying degrees of complexity and feature sets, both free and commercial. In many cases, the installation, configuration, and management of these tools is difficult and time-consuming.
Checkmk, however, is a monitoring solution that is both robust and simpler to install. It is a self-contained software bundle that combines Nagios (a popular and open-source alerting service) with add-ons for gathering, monitoring, and graphing data. It also comes with Checkmk’s web interface — a comprehensive tool that addresses many of Nagios’s shortcomings. It offers a user-friendly dashboard, a full-featured notification system, and a repository of easy-to-install monitoring agents for many Linux distributions. If it weren’t for Checkmk’s web interface, we would have to use different views for different tasks and it wouldn’t be possible to configure all these features without resorting to extensive file modifications.
In this guide we will set up Checkmk on an Ubuntu 18.04 server and monitor two separate hosts. We will monitor the Ubuntu server itself as well as a separate CentOS 7 server, but we could use the same approach to add any number of additional hosts to our monitoring configuration.
Prerequisites
- One Ubuntu 18.04 server with a regular, non-root user with sudo privileges. You can learn how to prepare your server by following this initial server setup tutorial.
- One CentOS 7 server with a regular, non-root user with sudo privileges. To prepare this server you can follow this initial server setup tutorial.
Step 1 — Installing Checkmk on Ubuntu
In order to use our monitoring site, we first must install Checkmk on the Ubuntu server. This will give us all the tools we need. Checkmk provides official ready-to-use Ubuntu package files that we can use to install the software bundle.
First, let’s update the packages list so that we have the most recent version of the repository listings:
- sudo apt update
To browse the packages we can go to the package listing site. Ubuntu 18.04, among others, can be selected in the page menu.
Now download the package:
- wget https://checkmk.com/support/1.6.0p8/check-mk-raw-1.6.0p8_0.bionic_amd64.deb
Then install the newly downloaded package:
- sudo apt install -y ./check-mk-raw-1.6.0p8_0.bionic_amd64.deb
This command will install the Checkmk package along with all necessary dependencies, including the Apache web server that is used to provide web access to the monitoring interface.
After the installation completes, we now can access the omd command. Try it out:
- sudo omd
This omd command will output the following:
OutputUsage (called as root):

 omd help                        Show general help

. . .

General Options:
 -V <version>                    set specific version, useful in combination with update/create
 omd COMMAND -h, --help          show available options of COMMAND
The omd command can manage all Checkmk instances on our server. It can start and stop all the monitoring services at once, and we will use it to create our Checkmk instance. First, however, we have to update our firewall settings to allow outside access to the default web ports.
Step 2 — Adjusting the Firewall Settings
Before we’ll be able to work with Checkmk, it’s necessary to allow outside access to the web server in the firewall configuration. Assuming that you followed the firewall configuration steps in the prerequisites, you’ll have a UFW firewall set up to restrict access to your server.
During installation, Apache registers itself with UFW to provide an easy way to enable or disable access to Apache through the firewall.
To allow access to Apache, use the following command:
- sudo ufw allow Apache
Now verify the changes:
- sudo ufw status
You’ll see that Apache is listed among the allowed services:
OutputStatus: active

To                         Action      From
--                         ------      ----
OpenSSH                    ALLOW       Anywhere
Apache                     ALLOW       Anywhere
OpenSSH (v6)               ALLOW       Anywhere (v6)
Apache (v6)                ALLOW       Anywhere (v6)
This will allow us to access the Checkmk web interface.
In the next step, we’ll create the first Checkmk monitoring instance.
Step 3 — Creating a Checkmk Monitoring Instance
Checkmk uses the concept of instances, or individual installations, to isolate multiple Checkmk copies on a server. In most cases, only one copy of Checkmk is enough and that’s how we will configure the software in this guide.
First we must give our new instance a name, and we will use monitoring throughout this text. To create the instance, type:
- sudo omd create monitoring
The omd tool will set up everything for us automatically. The command output will look similar to the following:
OutputAdding /opt/omd/sites/monitoring/tmp to /etc/fstab.
Creating temporary filesystem /omd/sites/monitoring/tmp...OK
Restarting Apache...OK
Created new site monitoring with version 1.6.0p8.cre.

  The site can be started with omd start monitoring.
  The default web UI is available at http://your_ubuntu_server/monitoring/

  The admin user for the web applications is cmkadmin with password: your-default-password
  (It can be changed with 'htpasswd -m ~/etc/htpasswd cmkadmin' as site user.)
  Please do a su - monitoring for administration of this site.
In this output the URL address, default username, and password for accessing our monitoring interface are highlighted. The instance is now created, but it still needs to be started. To start the instance, type:
- sudo omd start monitoring
Now all the necessary tools and services will be started at once. At the end we we’ll see an output verifying that all our services have started successfully:
OutputStarting mkeventd...OK
Starting rrdcached...OK
Starting npcd...OK
Starting nagios...OK
Starting apache...OK
Initializing Crontab...OK
The instance is up and running.
To access the Checkmk instance, open http://your_ubuntu_server_ip/monitoring/ in the web browser. You will be prompted for a password. Use the default credentials printed beforehand on the screen; we will change these defaults later on.
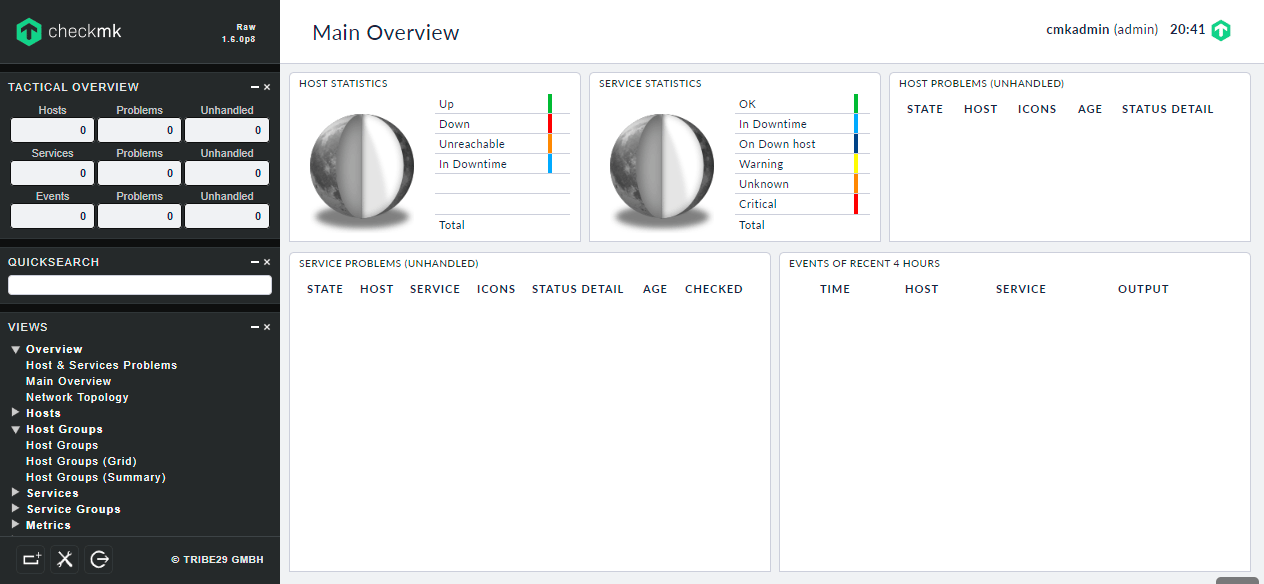
The Checkmk screen opens with a dashboard, which shows all our services and server statuses in lists, and it uses practical graphs resembling the Earth. Straight after installation these are empty, but we will shortly make it display statuses for our services and systems.
In the next step, we will change the default password to secure the site using this interface.
Step 4 — Changing Your Administrative Password
During installation, Checkmk generates a random password for the cmkadmin administrative user. This password is meant to be changed upon installation, and as such it is often short and not very secure. We can change this via the web interface.
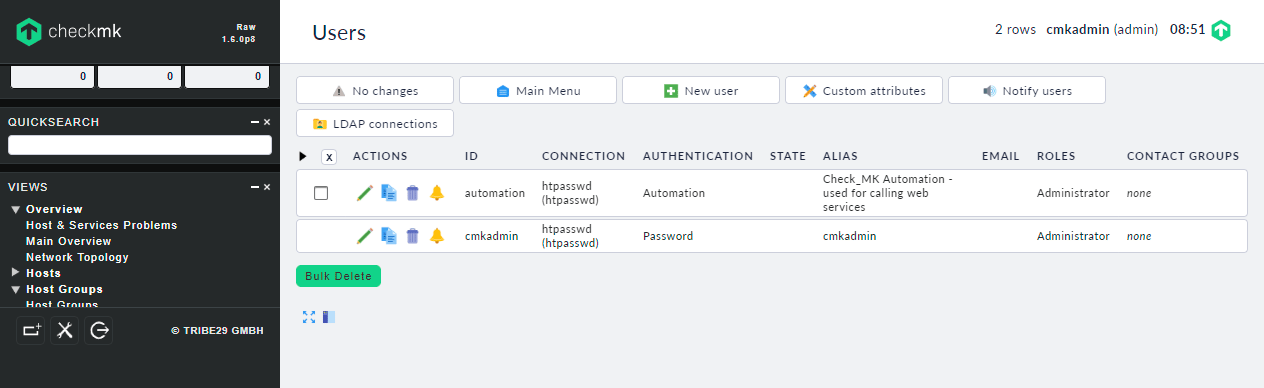
First, open the Users page from the WATO - Configuration menu on the left. The list will show all users that currently have access to the Checkmk site. On a fresh installation it will list only two users. The first one, automation, is intended for use with automated tools; the second is the cmkadmin user we used to log in to the site.
Click on the pencil icon next to the cmkadmin user to change its details, including the password.
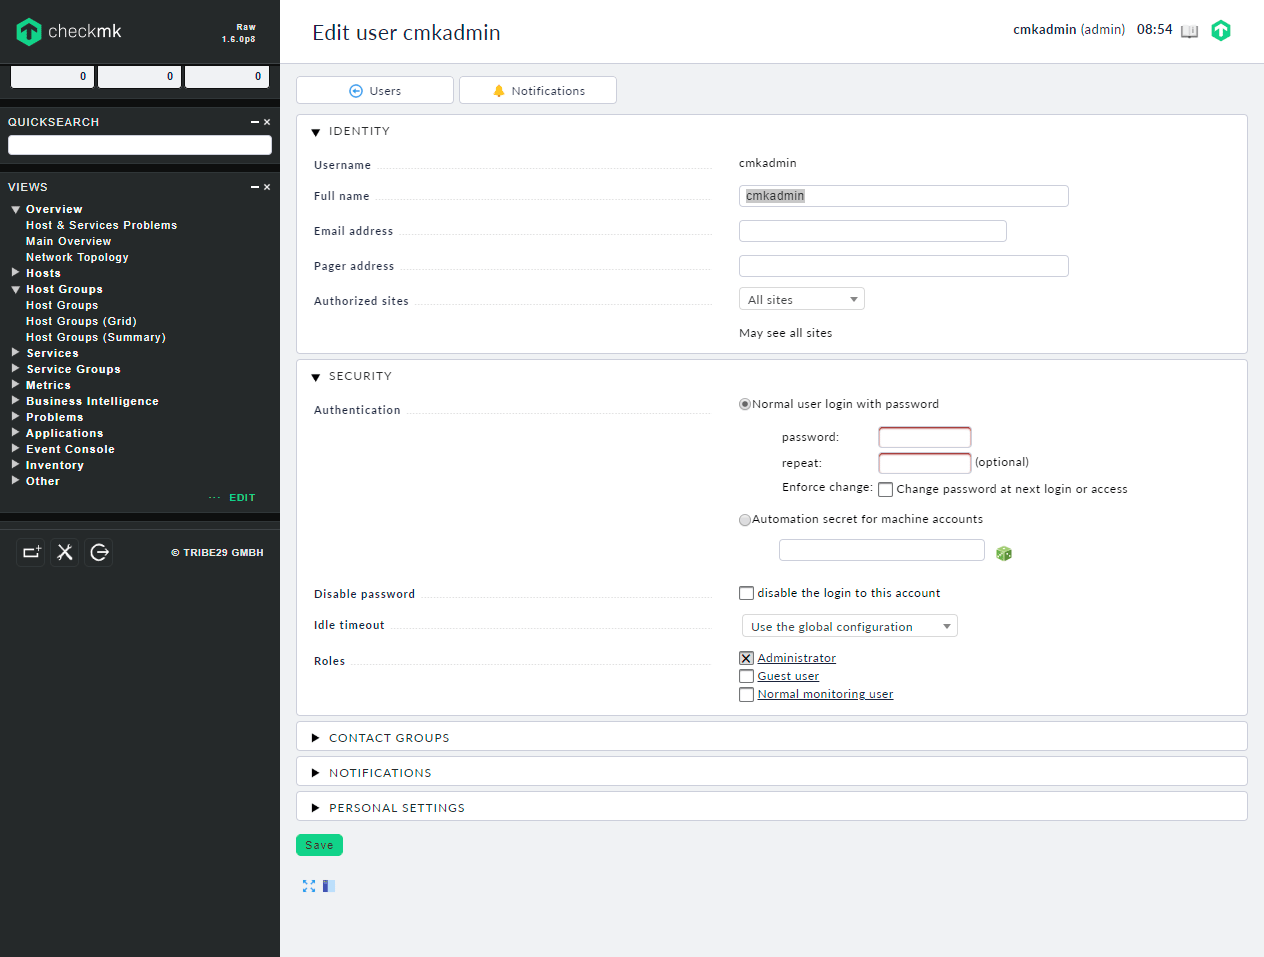
Update the password, add an admin email, and make any other desired changes.
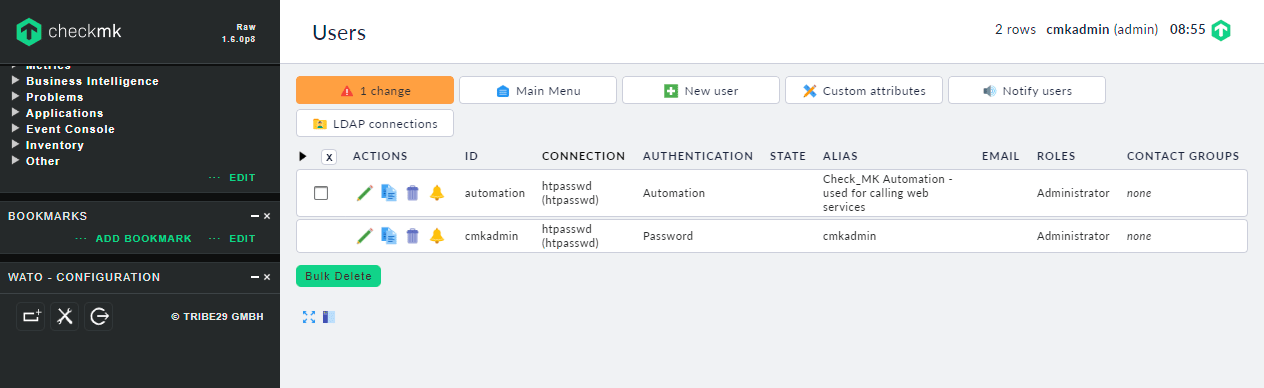
After saving the changes we will be asked to log in again using our new credentials. Do so and return to the dashboard, where there is one more thing we must do to fully apply our new configuration.
Once again open the Users page from the WATO - Configuration menu on the left. The orange button in the top left corner labeled as 1 Change tells us that we have made some changes to the configuration of Checkmk, and that we need to save and activate them. This will happen every time we change the configuration of our monitoring system, not only after editing a user’s credentials. To save and activate pending changes we have to click on this button and agree to activate the listed changes using the Activate affected option on the following screen.
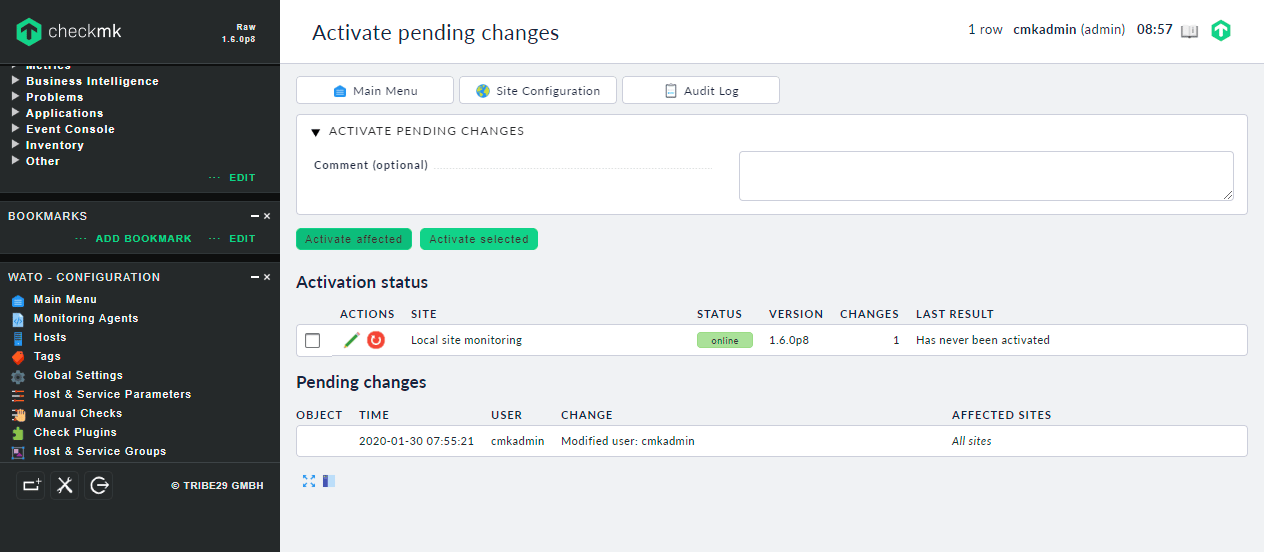
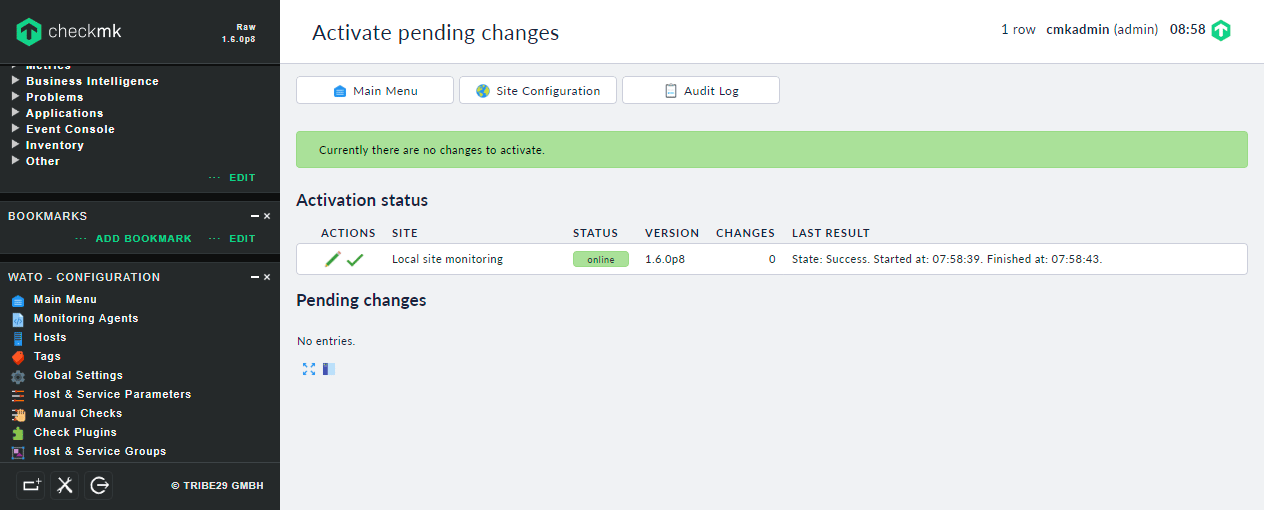
After activating the changes the new user’s data is written to the configuration files and it will be used by all the system’s components. Checkmk automatically takes care of notifying individual monitoring system components, reloading them when necessary, and managing all the needed configuration files.
The Checkmk installation is now ready for use. In the next step, we will add the first host to our monitoring system.
Step 5 — Monitoring the First Host
We are now ready to monitor the first host. To accomplish this, we will first install check-mk-agent on the Ubuntu server. Then, we’ll restrict access to the monitoring data using xinetd.
The components installed with Checkmk are responsible for receiving, storing, and presenting monitoring information. They do not provide the information itself.
To gather the actual data, we will use Checkmk agent. Designed specifically for the job, Checkmk agent is capable of monitoring all vital system components at once and reporting that information back to the Checkmk instance.
Installing the agent
The first host we will monitor will be your_ubuntu_server—the server on which we have installed the Checkmk instance itself.
To begin, we must install the Checkmk agent. Packages for all major distributions, including Ubuntu, are available directly from the web interface. Open the Monitoring Agents page from the WATO - Configuration menu on the left. You will see the available agent downloads with the most popular packages under the first section labeled Packaged agents.
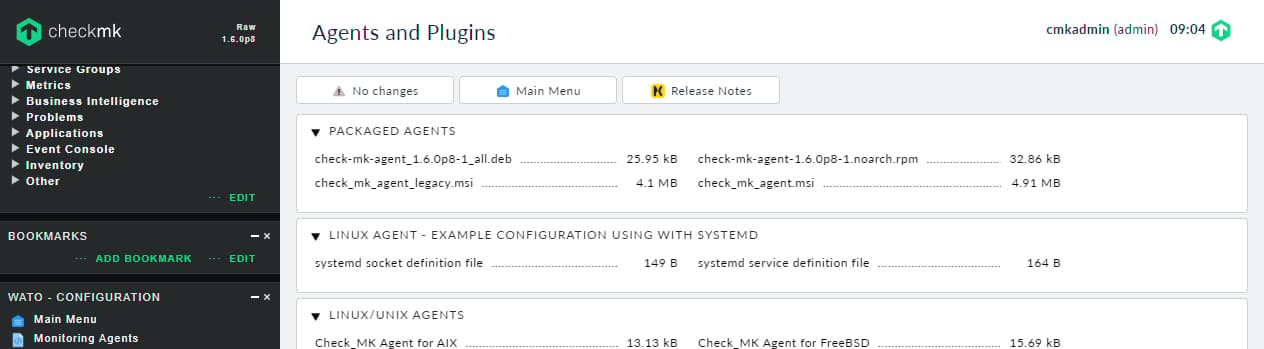
The package check-mk-agent_1.6.0p8-1_all.deb is the one suited for Debian based distributions, including Ubuntu. Copy the download link for that package from the web browser and use that address to download the package.
- wget http://your_ubuntu_server_ip/monitoring/check_mk/agents/check-mk-agent_1.6.0p8-1_all.deb
After downloading, install the package:
- apt install -y ./check-mk-agent_1.6.0p8-1_all.deb
Now verify that the agent has been successfully installed:
- check_mk_agent
The command will output a very long text that looks like gibberish but combines all vital information about the system in one place.
Output<<<check_mk>>>
Version: 1.6.0p8
AgentOS: linux
. . .
["monitoring"]
<<<job>>>
<<<local>>>
It is the output from this command that Checkmk uses to gather status data from monitored hosts. Now, we’ll restrict access to the monitoring data with xinetd.
Restricting Access to Monitoring Data Using xinetd
By default, the data from check_mk_agent is served using xinetd, a mechanism that outputs data on a certain network port upon accessing it. This means that we can access the check_mk_agent by using telnet to port 6556 (the default port for Checkmk) from any other computer on the internet unless our firewall configuration disallows it.
It is not a good security policy to publish vital information about servers to anyone on the internet. We should allow only hosts that run Checkmk and are under our supervision to access this data, so that only our monitoring system can gather it.
If you have followed the initial server setup tutorial including the steps about setting up a firewall, then access to Checkmk agent is by default blocked. It is, however, a good practice to enforce these access restrictions directly in the service configuration and not rely only on the firewall to guard it.
To restrict access to the agent data, we have to edit the configuration file at /etc/xinetd.d/check_mk. Open the configuration file in your favorite editor. To use nano, type:
- sudo nano /etc/xinetd.d/check_mk
Locate this section:
. . .
# configure the IP address(es) of your Nagios server here:
#only_from      = 127.0.0.1 10.0.20.1 10.0.20.2
. . .
The only_from setting is responsible for restricting access to certain IP addresses. Because we are now working on monitoring the same server that Checkmk is running on, it is ok to allow only localhost to connect. Uncomment and update the configuration setting to:
. . .
# configure the IP address(es) of your Nagios server here:
only_from      = 127.0.0.1
. . .
Save and exit the file.
The xinetd daemon has to be restarted for changes to take place. Do so now:
- sudo systemctl restart xinetd
Now our agent is up and running and restricted to accept only local connections. We can proceed to configure monitoring for that host using Checkmk.
Configuring Host in Checkmk Web Interface
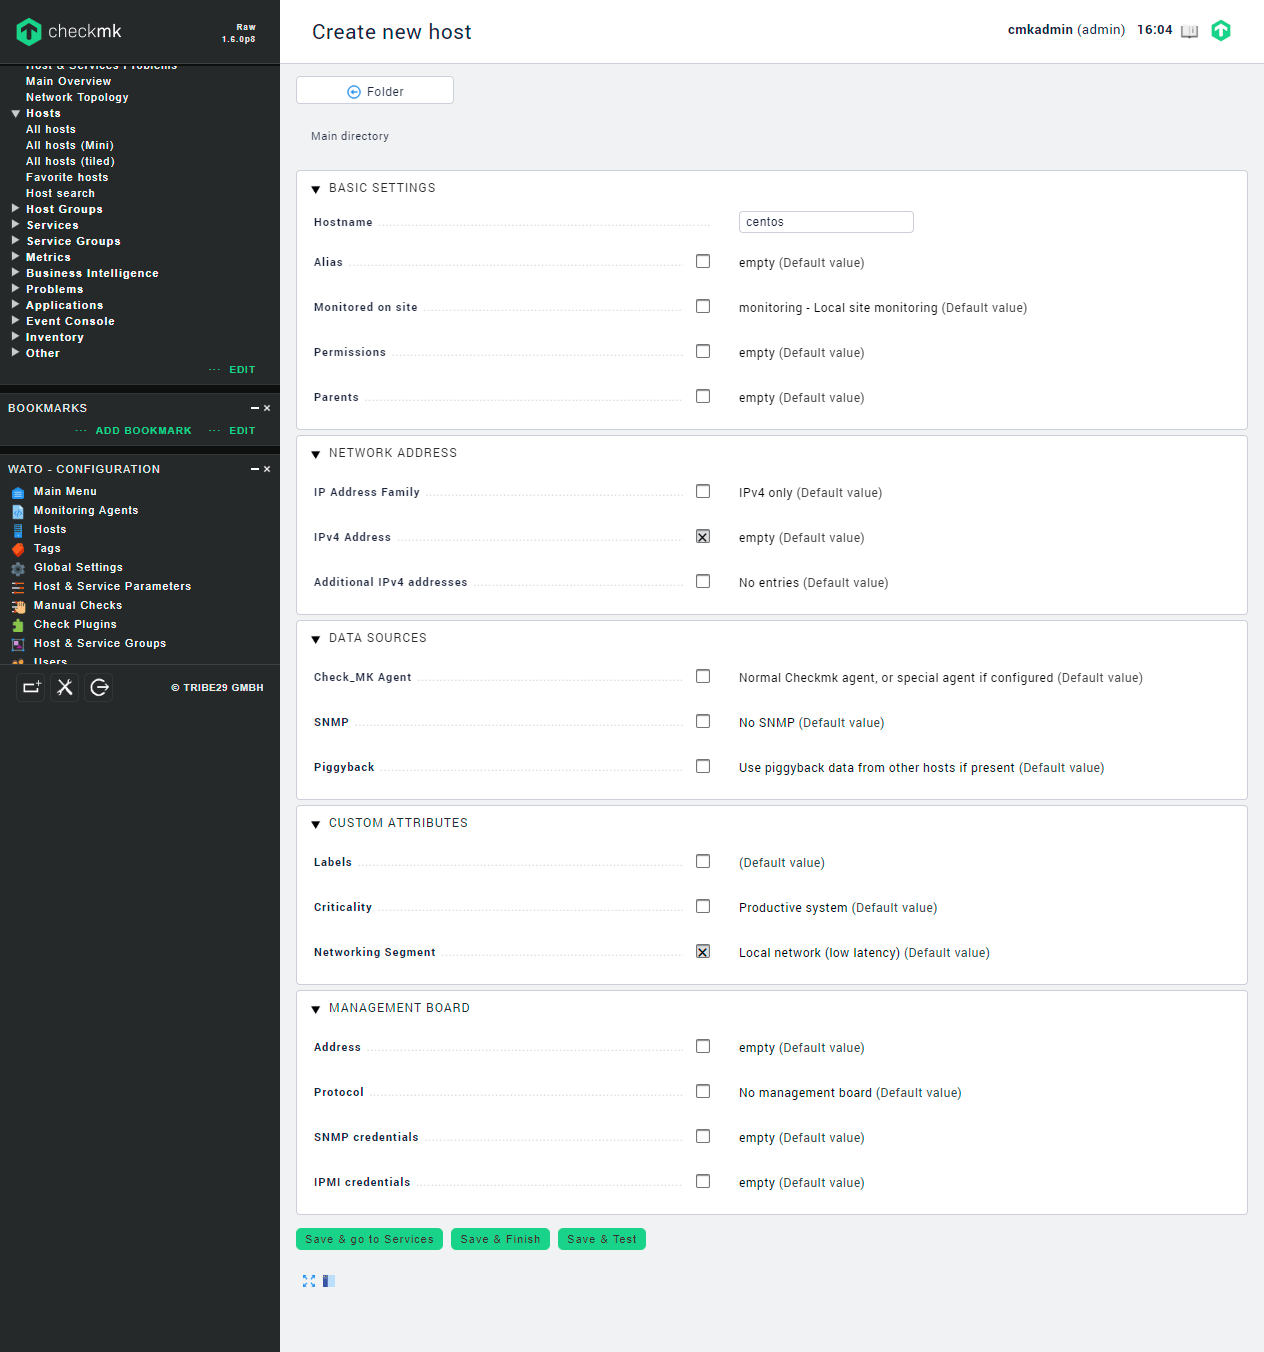
First, to add a new host to monitor we have to go to the Hosts menu in the WATO - Configuration menu on the left. From here click Create new host. We will be asked for some information about the host.
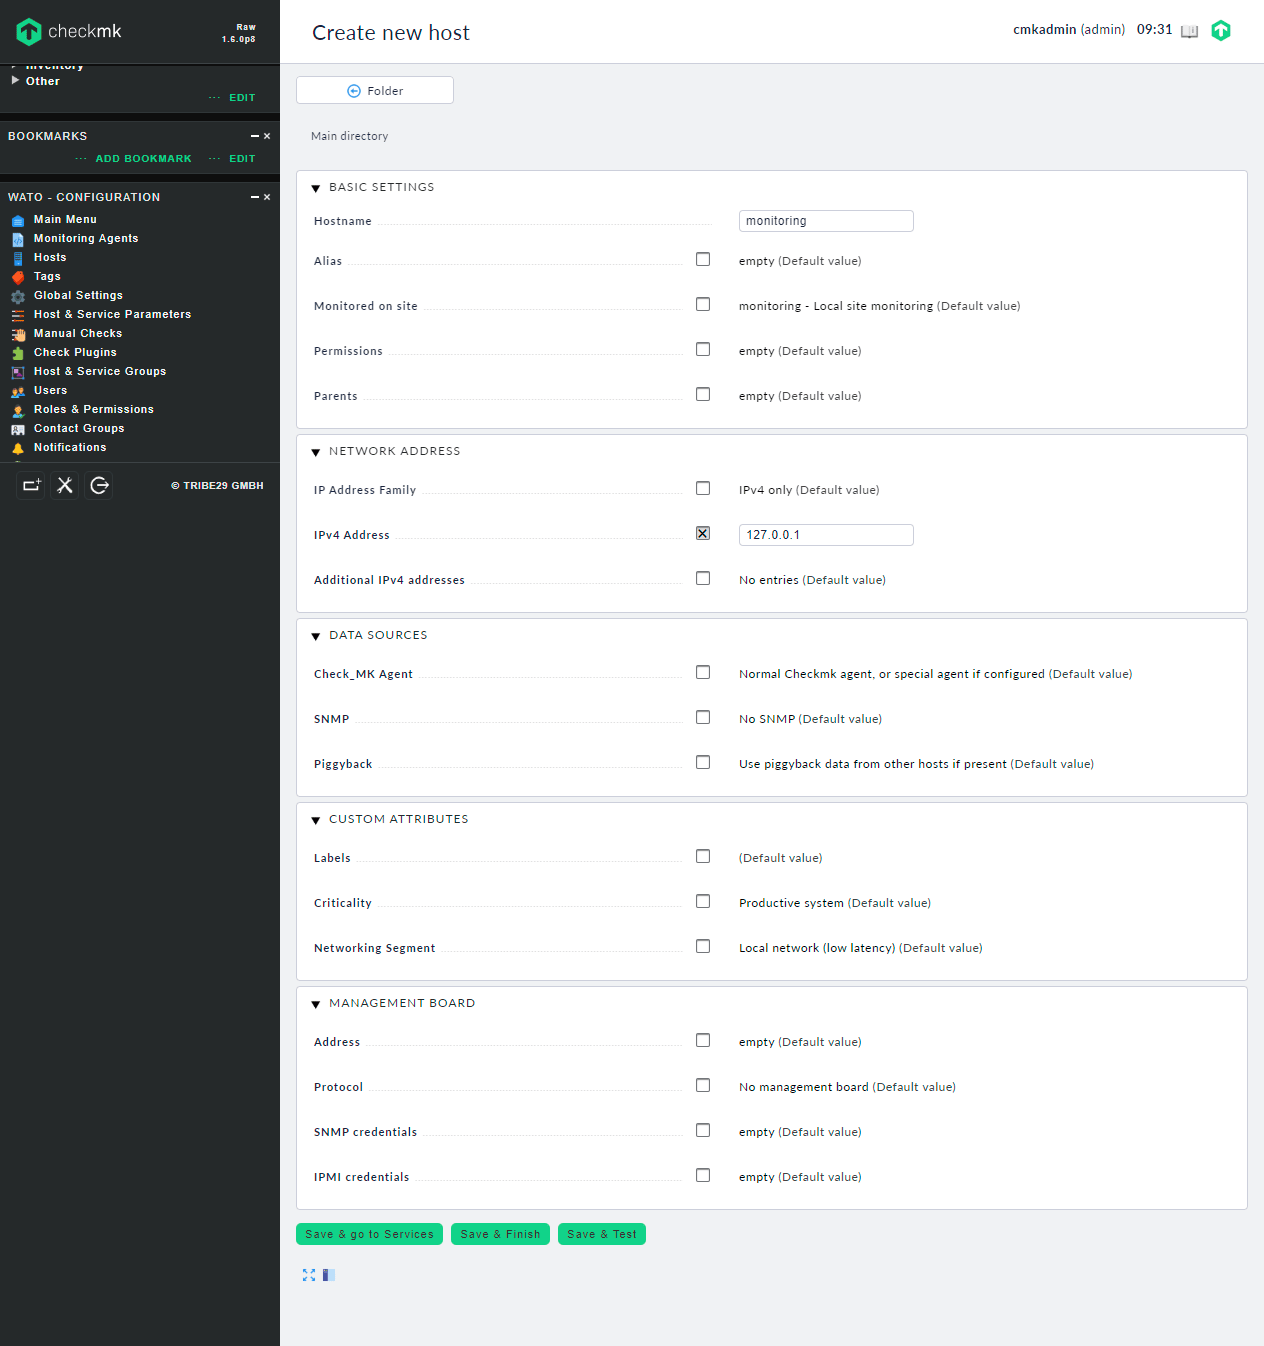
The Hostname is the familiar name that Checkmk will use for the monitoring. It may be a fully-qualified domain name, but it is not necessary. In this example, we will name the host monitoring, just like the name of the Checkmk instance itself. Because monitoring is not resolvable to our IP address, we also have to provide the IP address of our server. And since we are monitoring the local host, the IP will simply be 127.0.0.1. Check the IPv4 Address box to enable the manual IP input and enter the value in the text field.
The default configuration of the Data Sources section relies on Checkmk agent to provide monitoring data, which is fine. The Networking Segment setting is used to denote hosts on remote networks, which are characterized by a higher expected latency that is not a sign of malfunction. Since this is a local host, the default setting is fine as well.
To save the host and configure which services will be monitored, click the Save & go to services button.
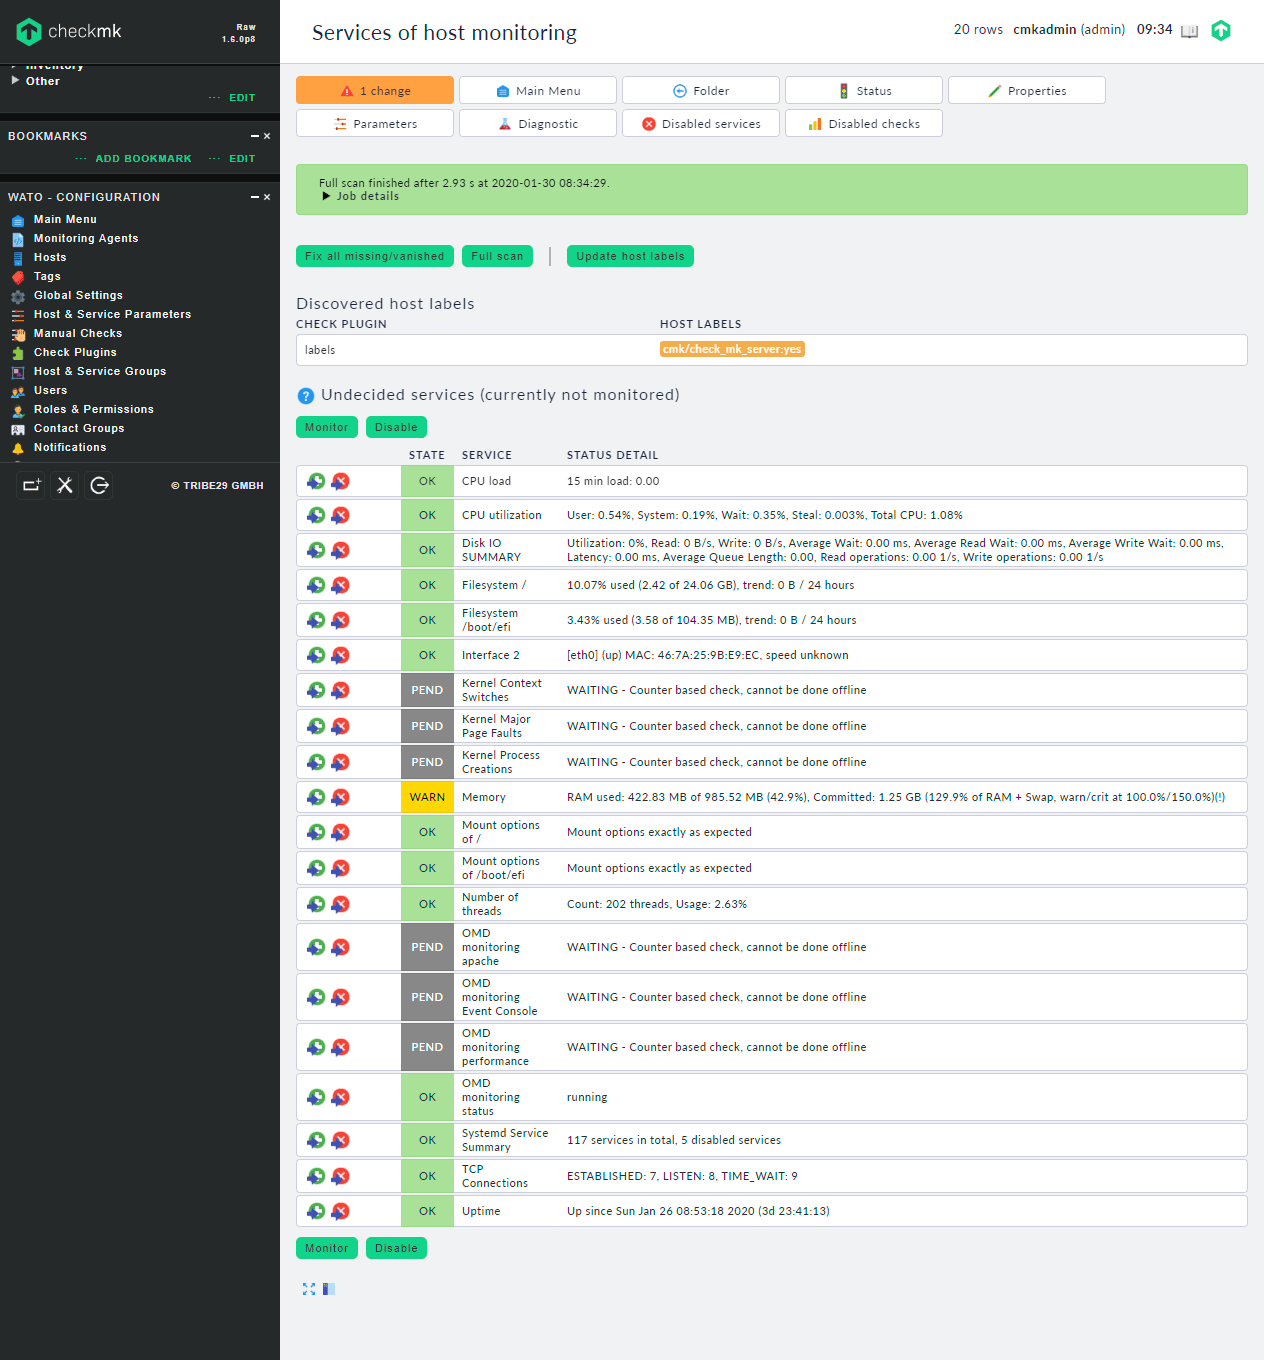
Checkmk will do an automatic inventory. That means it will gather the output from the agent and decipher it to know what kinds of services it can monitor. All available services for monitoring will be on the list, including CPU load, memory usage, and free space on disks.
To enable monitoring of all discovered services, we have to click the Monitor button under the Undecided services (currently not monitored) section. This will refresh the page, but now all services will be listed under the Monitored services section, informing us that they are indeed being monitored.
As was the case when changing our user password, these new changes must be saved and activated before they go live. Press the 2 changes button and accept the changes using the Activate affected button. After that, the host monitoring will be up and running.
Now you are ready to work with your server data. Take a look at the main dashboard using the Overview/Main Overview menu item on the left.
Working with Monitoring Data
Now let’s take a look at the main dashboard using the Overview/Main Overview menu item on the left:
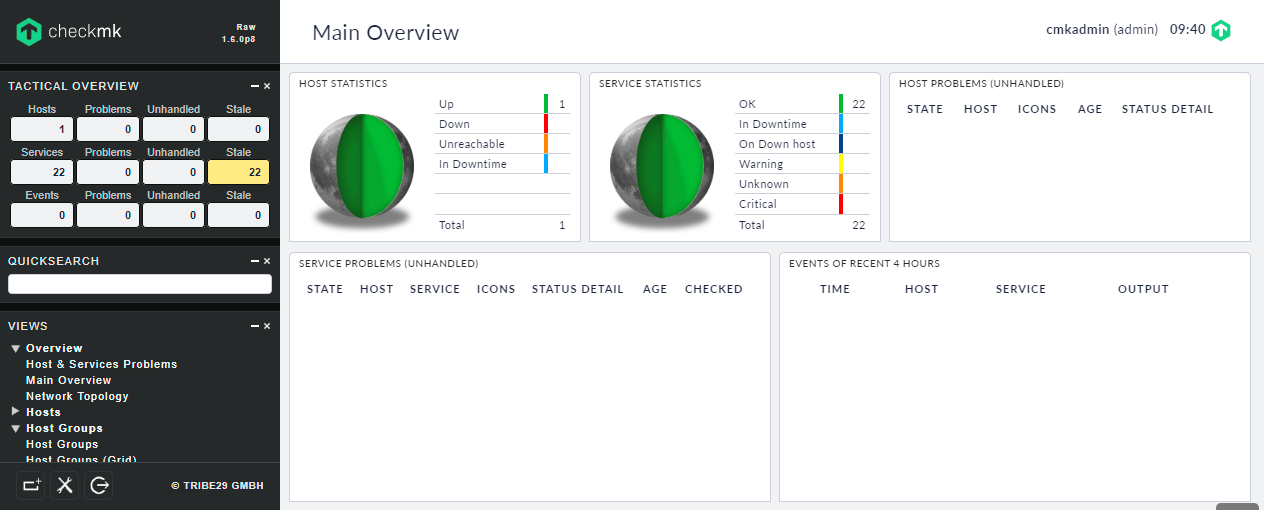
The Earth sphere is now fully green and the table says that one host is up with no problems. We can see the full host list, which now consists of a single host, in the Hosts/All hosts view (using the menu on the left).
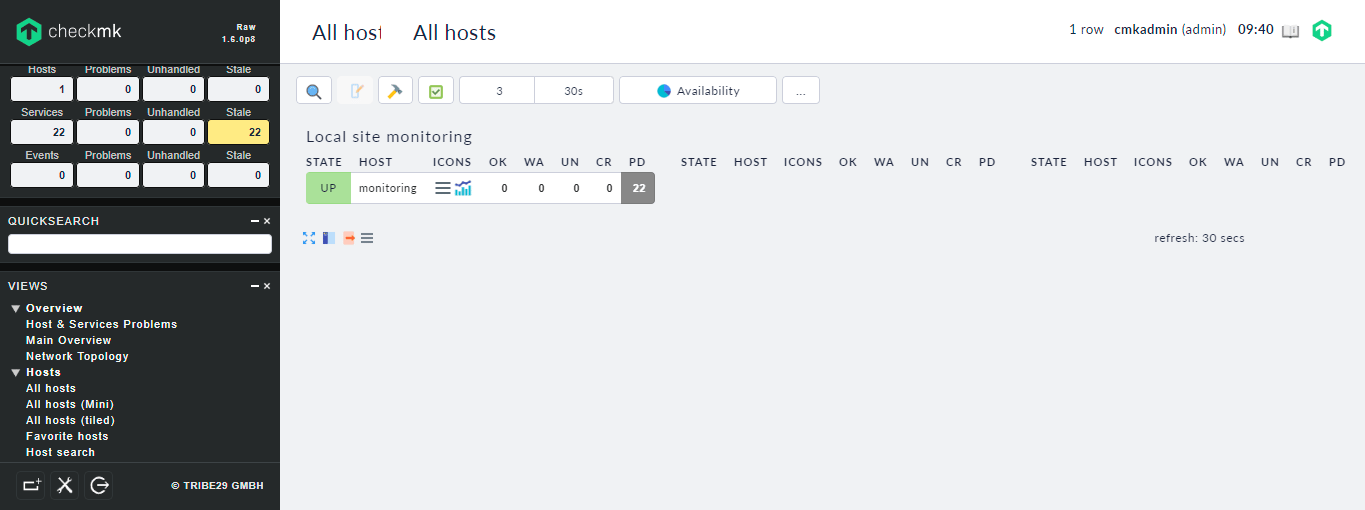
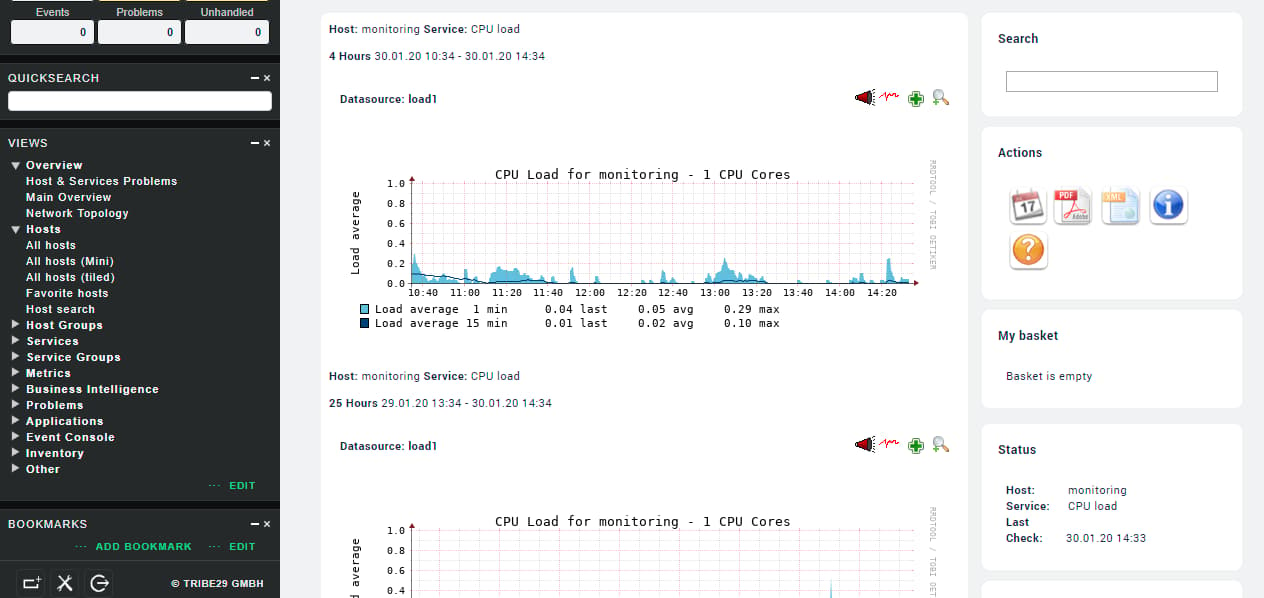
There we will see how many services are in good health (shown in green), how many are failing, and how many are pending to be checked. After clicking on the hostname we will be able to see the list of all services with their full statuses and their Perf-O-Meters. Perf-O-Meter shows the performance of a single service relative to what Checkmk considers to be good health.

All services that return graphable data display a graph icon next to their name. We can use that icon to get access to graphs associated with the service. Since the host monitoring is fresh, there is almost nothing on the graphs—but after some time the graphs will provide valuable information on how our service performance changes over time.
When any of these services fails or recovers, the information will be shown on the dashboard. For failing services a red error will be shown, and the problem will also be visible on the Earth graph.
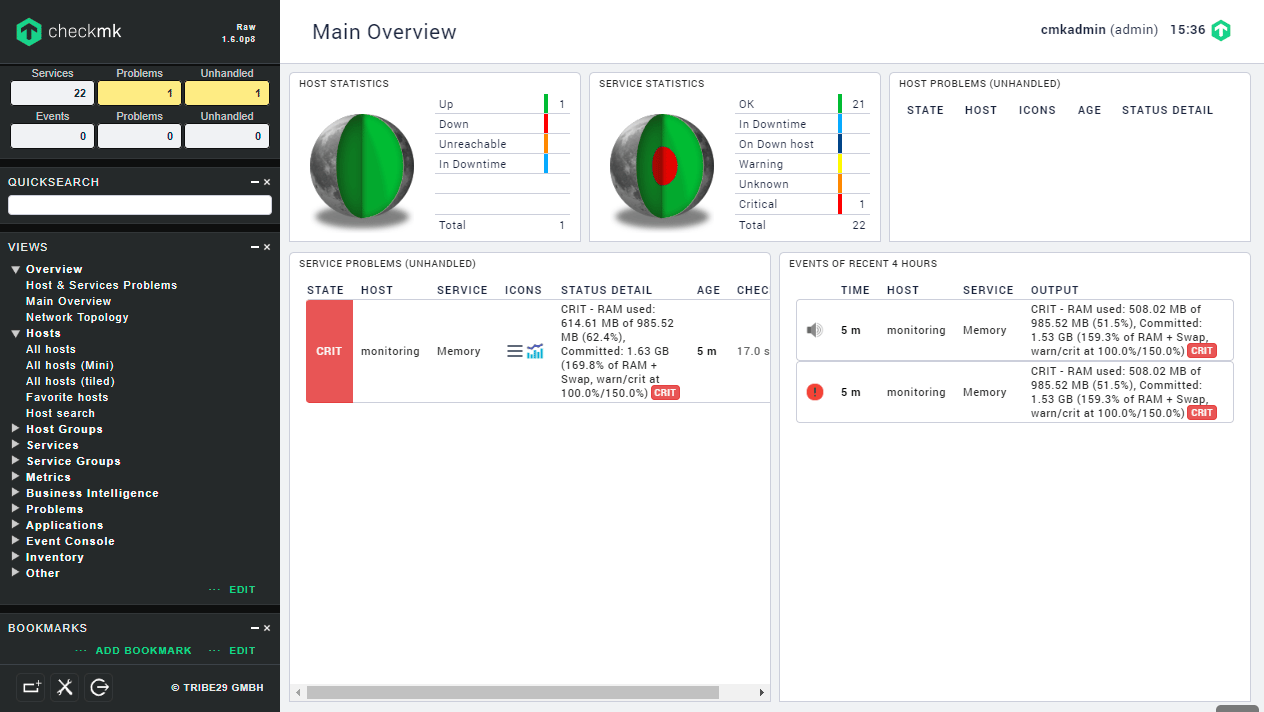
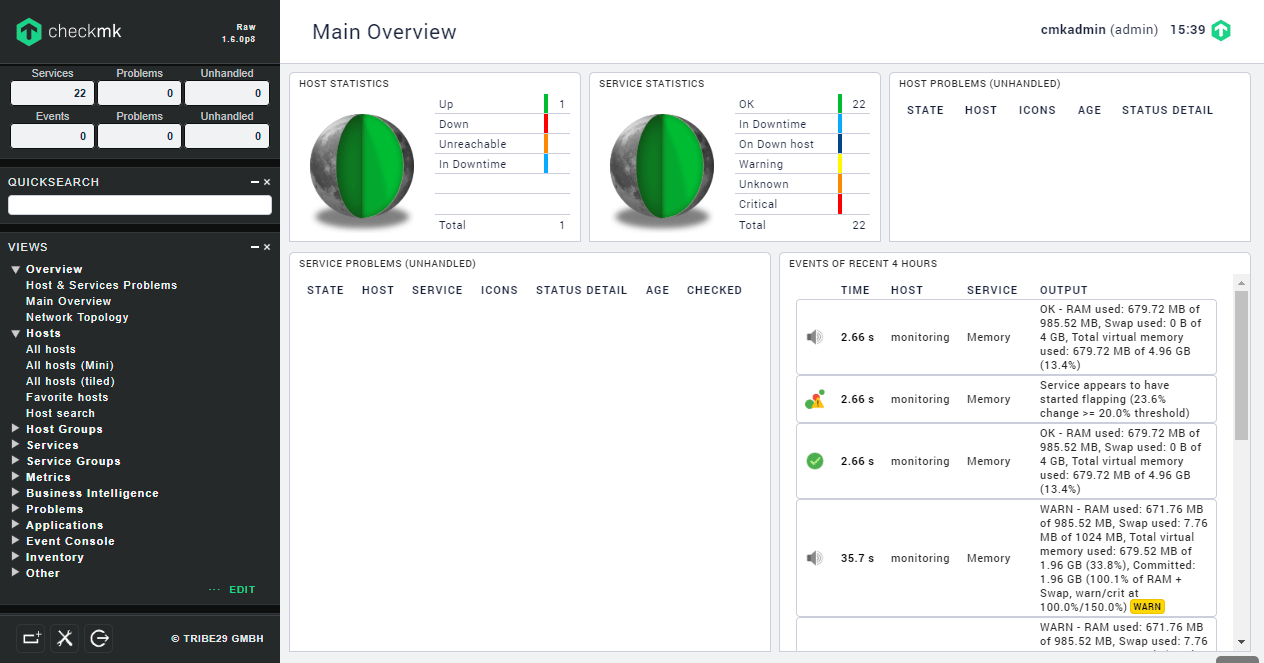
After recovery, everything will be shown in green as working properly, but the event log on the right will contain information about past failures.
Now that we have explored the dashboard a little, let’s add a second host to our monitoring instance.
Step 6 — Monitoring a Second CentOS Host
Monitoring gets really useful when you have multiple hosts. We will now add a second server to our Checkmk instance, this time running CentOS 7.
As with our Ubuntu server, installing Checkmk agent is necessary to gather monitoring data on CentOS. This time, however, we will need an rpm package from the Monitoring Agents page in the web interface, called check-mk-agent-1.6.0p8-1.noarch.rpm.
First, however, we must install xinetd, which by default is not available on the CentOS installation. Xinetd, we will remember, is a daemon that is responsible for making the monitoring data provided by check_mk_agent available over the network.
On your CentOS server, first install xinetd:
- sudo yum install -y xinetd
Now we can download and install the monitoring agent package needed for our CentOS server:
- sudo yum install -y http://your_ubuntu_server_ip/monitoring/check_mk/agents/check-mk-agent-1.6.0p8-1.noarch.rpm
Just like before, we can verify that the agent is working properly by executing check_mk_agent:
- sudo check_mk_agent
The output will be similar to that from the Ubuntu server. Now we will restrict access to the agent.
Restricting Access
This time we will not be monitoring a local host, so xinetd must allow connections coming from the Ubuntu server, where Checkmk is installed, to gather the data. To allow that, first open your configuration file:
- sudo vi /etc/xinetd.d/check_mk
Here you will see the configuration for your check_mk service, specifying how Checkmk agent can be accessed through the xinetd daemon. Find the following two commented lines:
. . .
# configure the IP address(es) of your Nagios server here:
#only_from      = 127.0.0.1 10.0.20.1 10.0.20.2
. . .
Now uncomment the second line and replace the local IP addresses with your_ubuntu_server_ip:
. . .
# configure the IP address(es) of your Nagios server here:
only_from      = your_ubuntu_server_ip
. . .
Save and exit the file by typing :x and then ENTER. Restart the xinetd service using:
- sudo systemctl restart xinetd
We can now proceed to configure Checkmk to monitor our CentOS 7 host.
Configuring the New Host in Checkmk
To add additional hosts to Checkmk, we use the Hosts menu just like before. This time we will name the host centos, configure its IP address, and choose WAN (high-latency) under the Networking Segment select box, since the host is on another network. If we skipped this and left it as local, Checkmk would soon alert us that the host is down, since it would expect it to respond to agent queries much quicker than is possible over the internet.
Click Save & go to services, which will show services available for monitoring on the CentOS server. The list will be very similar to the one from the first host. Again, this time we also must click Monitor and then activate the changes using the orange button on the top left corner.
After activating the changes, we can verify that the host is monitored on the All hosts page. Go there. Two hosts, monitoring and centos, will now be visible.
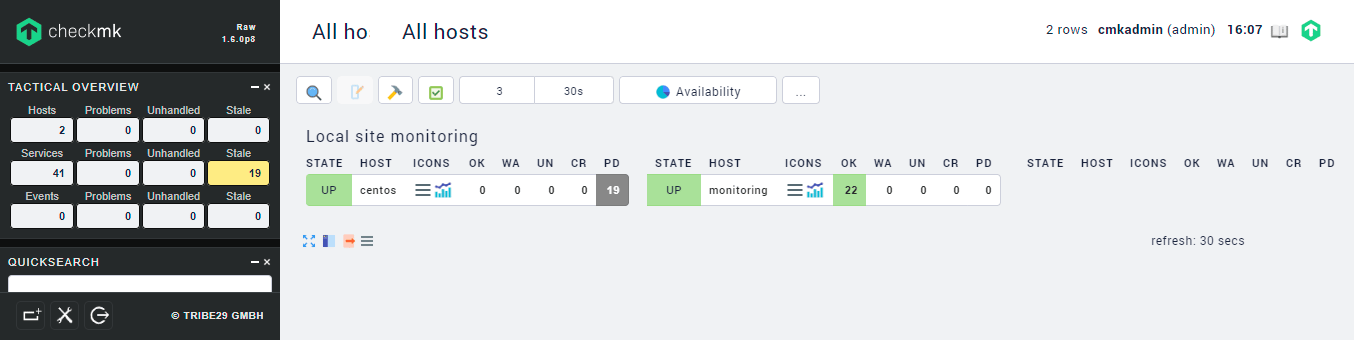
You are now monitoring an Ubuntu server and a CentOS server with Checkmk. It is possible to monitor even more hosts. In fact, there is no upper limit other than server performance, which should not be a problem until your hosts number in the hundreds. Moreover, the procedure is the same for any other host. Checkmk agents in deb and rpm packages work on Ubuntu, CentOS, and the majority of other Linux distributions.
Conclusion
In this guide we set up two servers with two different Linux distributions: Ubuntu and CentOS. We then installed and configured Checkmk to monitor both servers, and explored Checkmk’s powerful web interface.
Checkmk allows for the easy setup of a complete and versatile monitoring system, which packs all the hard work of manual configuration into an easy-to-use web interface full of options and features. With these tools it is possible to monitor multiple hosts; set up email, SMS, or push notifications for problems; set up additional checks for more services; monitor accessibility and performance, and so on.
To learn more about Checkmk, make sure to visit the official documentation.
Thanks for learning with the DigitalOcean Community. Check out our offerings for compute, storage, networking, and managed databases.
About the author(s)
Creating bespoke software ◦ CTO & co-founder at Makimo. I'm a software enginner & a geek. I like making impossible things possible. And I need tea.
Supporting the open-source community one tutorial at a time. Former Technical Editor at DigitalOcean. Expertise in topics including Ubuntu 22.04, Ubuntu 20.04, CentOS, and more.
Still looking for an answer?
This textbox defaults to using Markdown to format your answer.
You can type !ref in this text area to quickly search our full set of tutorials, documentation & marketplace offerings and insert the link!
 This work is licensed under a Creative Commons Attribution-NonCommercial- ShareAlike 4.0 International License.
Become a contributor for community
Get paid to write technical tutorials and select a tech-focused charity to receive a matching donation.

DigitalOcean Documentation
Full documentation for every DigitalOcean product.

Resources for startups and AI-native businesses
The Wave has everything you need to know about building a business, from raising funding to marketing your product.
The developer cloud
Scale up as you grow — whether you're running one virtual machine or ten thousand.

Start building today
From GPU-powered inference and Kubernetes to managed databases and storage, get everything you need to build, scale, and deploy intelligent applications.
