By Savic and Kathryn Hancox

The author selected the Free and Open Source Fund to receive a donation as part of the Write for DOnations program.
Introduction
Database monitoring is key to understanding how a database performs over time. It can help you uncover hidden usage problems and bottlenecks happening in your database. Implementing database monitoring systems can quickly turn out to be a long-term advantage, which will positively influence your infrastructure management process. You’ll be able to swiftly react to status changes of your database and will quickly be notified when monitored services return to normal functioning.
Nagios Core is a popular monitoring system that you can use to monitor your managed database. The benefits of using Nagios for this task are its versatility—it’s easy to configure and use—a large repository of available plugins, and most importantly, integrated alerting.
In this tutorial, you will set up PostgreSQL database monitoring in Nagios Core using the check_postgres Nagios plugin and set up Slack-based alerting. In the end, you’ll have a monitoring system in place for your managed PostgreSQL database, and will be notified of status changes of various functionality immediately.
Prerequisites
-
An Ubuntu 18.04 server with root privileges, and a secondary, non-root account. You can set this up by following this initial server setup guide. For this tutorial the non-root user is
sammy. -
Nagios Core installed on your server. To achieve this, complete the first five steps of the How To Install Nagios 4 and Monitor Your Servers on Ubuntu 18.04 tutorial.
-
A DigitalOcean account and a PostgreSQL managed database provisioned from DigitalOcean with connection information available. Make sure that your server’s IP address is on the whitelist. To learn more about DigitalOcean Managed Databases, visit the product docs.
-
A Slack account with full access, added to a workspace where you’ll want to receive status updates.
Step 1 — Installing check_postgres
In this section, you’ll download the latest version of the check_postgres plugin from Github and make it available to Nagios Core. You’ll also install the PostgreSQL client (psql), so that check_postgres will be able to connect to your managed database.
Start off by installing the PostgreSQL client by running the following command:
- sudo apt install postgresql-client
Next, you’ll download check_postgres to your home directory. First, navigate to it:
- cd ~
Head over to the Github releases page and copy the link of the latest version of the plugin. At the time of writing, the latest version of check_postgres was 2.24.0; keep in mind that this will update, and where possible it’s best practice to use the latest version.
Now download it using curl:
- curl -LO https://github.com/bucardo/check_postgres/releases/download/2.24.0/check_postgres-2.24.0.tar.gz
Extract it using the following command:
- tar xvf check_postgres-*.tar.gz
This will create a directory with the same name as the file you have downloaded. That folder contains the check_postgres executable, which you’ll need to copy to the directory where Nagios stores its plugins (usually /usr/local/nagios/libexec/). Copy it by running the following command:
- sudo cp check_postgres-*/check_postgres.pl /usr/local/nagios/libexec/
Next, you’ll need to give the nagios user ownership of it, so that it can be run from Nagios:
- sudo chown nagios:nagios /usr/local/nagios/libexec/check_postgres.pl
check_postgres is now available to Nagios and can be used from it. However, it provides a lot of commands pertaining to different aspects of PostgreSQL, and for better service maintainability, it’s better to break them up so that they can be called separately. You’ll achieve this by creating a symlink to every check_postgres command in the plugin directory.
Navigate to the directory where Nagios stores plugins by running the following command:
- cd /usr/local/nagios/libexec
Then, create the symlinks with:
- sudo perl check_postgres.pl --symlinks
The output will look like this:
OutputCreated "check_postgres_archive_ready"
Created "check_postgres_autovac_freeze"
Created "check_postgres_backends"
Created "check_postgres_bloat"
Created "check_postgres_checkpoint"
Created "check_postgres_cluster_id"
Created "check_postgres_commitratio"
Created "check_postgres_connection"
Created "check_postgres_custom_query"
Created "check_postgres_database_size"
Created "check_postgres_dbstats"
Created "check_postgres_disabled_triggers"
Created "check_postgres_disk_space"
Created "check_postgres_fsm_pages"
Created "check_postgres_fsm_relations"
Created "check_postgres_hitratio"
Created "check_postgres_hot_standby_delay"
Created "check_postgres_index_size"
Created "check_postgres_indexes_size"
Created "check_postgres_last_analyze"
Created "check_postgres_last_autoanalyze"
Created "check_postgres_last_autovacuum"
Created "check_postgres_last_vacuum"
Created "check_postgres_listener"
Created "check_postgres_locks"
Created "check_postgres_logfile"
Created "check_postgres_new_version_bc"
Created "check_postgres_new_version_box"
Created "check_postgres_new_version_cp"
Created "check_postgres_new_version_pg"
Created "check_postgres_new_version_tnm"
Created "check_postgres_pgagent_jobs"
Created "check_postgres_pgb_pool_cl_active"
Created "check_postgres_pgb_pool_cl_waiting"
Created "check_postgres_pgb_pool_maxwait"
Created "check_postgres_pgb_pool_sv_active"
Created "check_postgres_pgb_pool_sv_idle"
Created "check_postgres_pgb_pool_sv_login"
Created "check_postgres_pgb_pool_sv_tested"
Created "check_postgres_pgb_pool_sv_used"
Created "check_postgres_pgbouncer_backends"
Created "check_postgres_pgbouncer_checksum"
Created "check_postgres_prepared_txns"
Created "check_postgres_query_runtime"
Created "check_postgres_query_time"
Created "check_postgres_relation_size"
Created "check_postgres_replicate_row"
Created "check_postgres_replication_slots"
Created "check_postgres_same_schema"
Created "check_postgres_sequence"
Created "check_postgres_settings_checksum"
Created "check_postgres_slony_status"
Created "check_postgres_table_size"
Created "check_postgres_timesync"
Created "check_postgres_total_relation_size"
Created "check_postgres_txn_idle"
Created "check_postgres_txn_time"
Created "check_postgres_txn_wraparound"
Created "check_postgres_version"
Created "check_postgres_wal_files"
Perl listed all the functions it created a symlink for. These can now be executed from the command line as usual.
You’ve downloaded and installed the check_postgres plugin. You have also created symlinks to all the commands of the plugin, so that they can be used individually from Nagios. In the next step, you’ll create a connection service file, which check_postgres will use to connect to your managed database.
Step 2 — Configuring Your Database
In this section, you will create a PostgreSQL connection service file containing the connection information of your database. Then, you will test the connection data by invoking check_postgres on it.
The connection service file is by convention called pg_service.conf, and must be located under /etc/postgresql-common/. Create it for editing with your favorite editor (for example, nano):
- sudo nano /etc/postgresql-common/pg_service.conf
Add the following lines, replacing the highlighted placeholders with the actual values shown in your Managed Database Control Panel under the section Connection Details:
[managed-db]
host=host
port=port
user=username
password=password
dbname=defaultdb
sslmode=require
The connection service file can house multiple database connection info groups. The beginning of a group is signaled by putting its name in square brackets. After that comes the connection parameters (host, port, user, password, and so on), separated by new lines, which must be given a value.
Save and close the file when you are finished.
You’ll now test the validity of the configuration by connecting to the database via check_postgres by running the following command:
- ./check_postgres.pl --dbservice=managed-db --action=connection
Here, you tell check_postgres which database connection info group to use with the parameter --dbservice, and also specify that it should only try to connect to it by specifying connection as the action.
Your output will look similar to this:
OutputPOSTGRES_CONNECTION OK: service=managed-db version 11.4 | time=0.10s
This means that check_postgres succeeded in connecting to the database, according to the parameters from pg_service.conf. If you get an error, double check what you have just entered in that config file.
You’ve created and filled out a PostgreSQL connection service file, which works as a connection string. You have also tested the connection data by running check_postgres on it and observing the output. In the next step, you will configure Nagios to monitor various parts of your database.
Step 3 — Creating Monitoring Services in Nagios
Now you will configure Nagios to watch over various metrics of your database by defining a host and multiple services, which will call the check_postgres plugin and its symlinks.
Nagios stores your custom configuration files under /usr/local/nagios/etc/objects. New files you add there must be manually enabled in the central Nagios config file, located at /usr/local/nagios/etc/nagios.cfg. You’ll now define commands, a host, and multiple services, which you’ll use to monitor your managed database in Nagios.
First, create a folder under /usr/local/nagios/etc/objects to store your PostgreSQL related configuration by running the following command:
- sudo mkdir /usr/local/nagios/etc/objects/postgresql
You’ll store Nagios commands for check_nagios in a file named commands.cfg. Create it for editing:
- sudo nano /usr/local/nagios/etc/objects/postgresql/commands.cfg
Add the following lines:
define command {
    command_name           check_postgres_connection
    command_line           /usr/local/nagios/libexec/check_postgres_connection --dbservice=$ARG1$
}

define command {
    command_name           check_postgres_database_size
    command_line           /usr/local/nagios/libexec/check_postgres_database_size --dbservice=$ARG1$ --critical='$ARG2$'
}

define command {
    command_name           check_postgres_locks
    command_line           /usr/local/nagios/libexec/check_postgres_locks --dbservice=$ARG1$
}

define command {
    command_name           check_postgres_backends
    command_line           /usr/local/nagios/libexec/check_postgres_backends --dbservice=$ARG1$
}
Save and close the file.
In this file, you define four Nagios commands that call different parts of the check_postgres plugin (checking connectivity, getting the number of locks and connections, and the size of the whole database). They all accept an argument that is passed to the --dbservice parameter, and specify which of the databases defined in pg_service.conf to connect to.
The check_postgres_database_size command accepts a second argument that gets passed to the --critical parameter, which specifies the point at which the database storage is becoming full. Accepted values include 1 KB for a kilobyte, 1 MB for a megabyte, and so on, up to exabytes (EB). A number without a capacity unit is treated as being expressed in bytes.
Now that the necessary commands are defined, you’ll define the host (essentially, the database) and its monitoring services in a file named services.cfg. Create it using your favorite editor:
- sudo nano /usr/local/nagios/etc/objects/postgresql/services.cfg
Add the following lines, replacing db_max_storage_size with a value pertaining to the available storage of your database. It is recommended to set it to 90 percent of the storage size you have allocated to it:
define host {
      use                    linux-server
      host_name              postgres
      check_command          check_postgres_connection!managed-db
}

define service {
      use                    generic-service
      host_name              postgres
      service_description    PostgreSQL Connection
      check_command          check_postgres_connection!managed-db
      notification_options   w,u,c,r,f,s
}

define service {
      use                    generic-service
      host_name              postgres
      service_description    PostgreSQL Database Size
      check_command          check_postgres_database_size!managed-db!db_max_storage_size
      notification_options   w,u,c,r,f,s
}

define service {
      use                    generic-service
      host_name              postgres
      service_description    PostgreSQL Locks
      check_command          check_postgres_locks!managed-db
      notification_options   w,u,c,r,f,s
}

define service {
      use                    generic-service
      host_name              postgres
      service_description    PostgreSQL Backends
      check_command          check_postgres_backends!managed-db
      notification_options   w,u,c,r,f,s
}
You first define a host, so that Nagios will know what entity the services relate to. Then, you create four services, which call the commands you just defined. Each one passes managed-db as the argument, detailing that the managed-db you defined in Step 2 should be monitored.
Regarding notification options, each service specifies that notifications should be sent out when the service state becomes WARNING, UNKNOWN, CRITICAL, OK (when it recovers from downtime), when the service starts flapping, or when scheduled downtime starts or ends. Without explicitly giving this option a value, no notifications would be sent out (to available contacts) at all, except if triggered manually.
Save and close the file.
Next, you’ll need to explicitly tell Nagios to read config files from this new directory, by editing the general Nagios config file. Open it for editing by running the following command:
- sudo nano /usr/local/nagios/etc/nagios.cfg
Find this highlighted line in the file:
...
# directive as shown below:

cfg_dir=/usr/local/nagios/etc/servers
#cfg_dir=/usr/local/nagios/etc/printers
...
Above it, add the following highlighted line:
...
cfg_dir=/usr/local/nagios/etc/objects/postgresql
cfg_dir=/usr/local/nagios/etc/servers
...
Save and close the file. This line tells Nagios to load all config files from the /usr/local/nagios/etc/objects/postgresql directory, where your configuration files are located.
Before restarting Nagios, check the validity of the configuration by running the following command:
- sudo /usr/local/nagios/bin/nagios -v /usr/local/nagios/etc/nagios.cfg
The end of the output will look similar to this:
OutputTotal Warnings: 0
Total Errors:   0

Things look okay - No serious problems were detected during the pre-flight check
This means that Nagios found no errors in the configuration. If it shows you an error, you’ll also see a hint as to what went wrong, so you’ll be able to fix the error more easily.
To make Nagios reload its configuration, restart its service by running the following command:
- sudo systemctl restart nagios
You can now navigate to Nagios in your browser. Once it loads, press on the Services option from the left-hand menu. You’ll see the postgres host and a list of services, along with their current statuses:
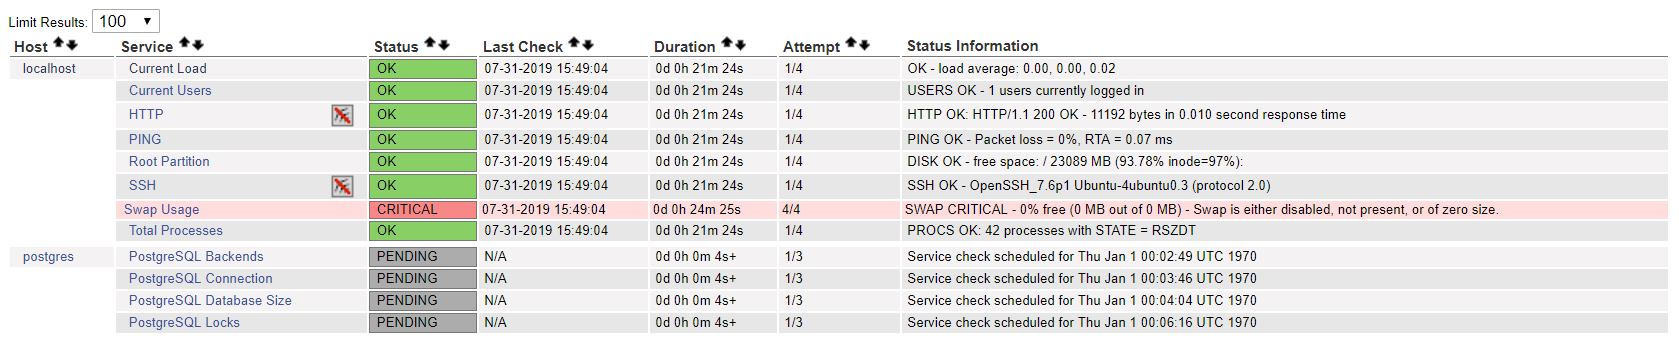
They will all soon turn to green and show an OK status. You’ll see the command output under the Status Information column. You can click on the service name and see detailed information about its status and availability.
You’ve added check_postgres commands, a host, and multiple services to your Nagios installation to monitor your database. You’ve also checked that the services are working properly by examining them via the Nagios web interface. In the next step, you will configure Slack-based alerting.
Step 4 — Configuring Slack Alerting
In this section, you will configure Nagios to alert you about events via Slack, by posting them into desired channels in your workspace.
Before you start, log in to your desired workspace on Slack and create two channels where you’ll want to receive status messages from Nagios: one for host, and the other one for service notifications. If you wish, you can create only one channel where you’ll receive both kinds of alerts.
Then, head over to the Nagios app in the Slack App Directory and press on Add Configuration. You’ll see a page for adding the Nagios Integration.
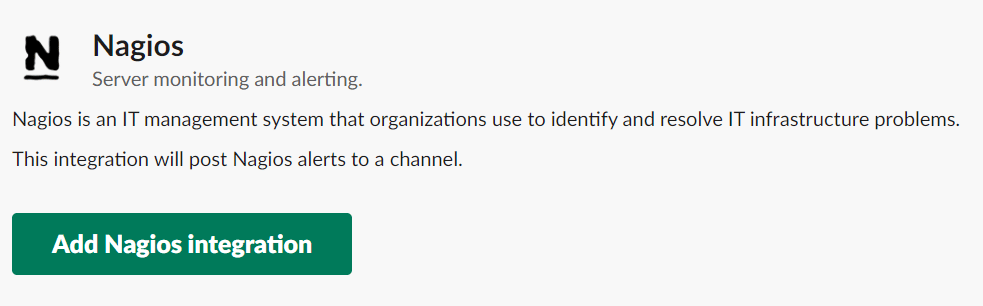
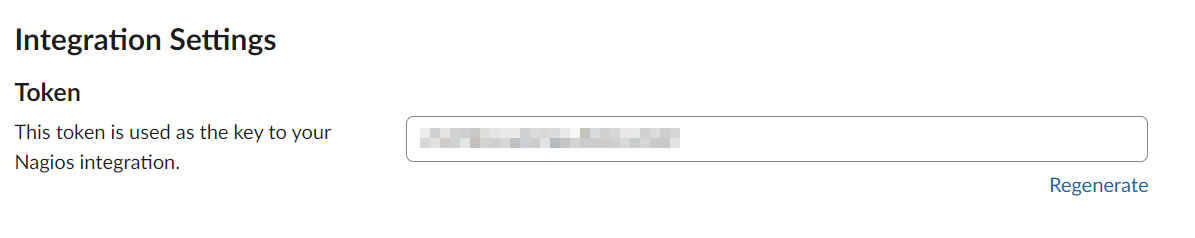
Press on Add Nagios Integration. When the page loads, scroll down and take note of the token, because you’ll need it further on.
You’ll now install and configure the Slack plugin (written in Perl) for Nagios on your server. First, install the required Perl prerequisites by running the following command:
- sudo apt install libwww-perl libcrypt-ssleay-perl -y
Then, download the plugin to your Nagios plugin directory:
- sudo curl https://raw.githubusercontent.com/tinyspeck/services-examples/master/nagios.pl -o slack.pl
Make it executable by running the following command:
- sudo chmod +x slack.pl
Now, you’ll need to edit it to connect to your workspace using the token you got from Slack. Open it for editing:
- sudo nano slack.pl
Find the following lines in the file:
...
my $opt_domain = "foo.slack.com"; # Your team's domain
my $opt_token = "your_token"; # The token from your Nagios services page
...
Replace foo.slack.com with your workspace domain and your_token with your Nagios app integration token, then save and close the file. The script will now be able to send proper requests to Slack, which you’ll now test by running the following command:
- ./slack.pl -field slack_channel=#your_channel_name -field HOSTALIAS="Test Host" -field HOSTSTATE="UP" -field HOSTOUTPUT="Host is UP" -field NOTIFICATIONTYPE="RECOVERY"
Replace your_channel_name with the name of the channel where you’ll want to receive status alerts. The script will output information about the HTTP request it made to Slack, and if everything went through correctly, the last line of the output will be ok. If you get an error, double check if the Slack channel you specified exists in the workspace.
You can now head over to your Slack workspace and select the channel you specified. You’ll see a test message coming from Nagios.

This confirms that you have properly configured the Slack script. You’ll now move on to configuring Nagios to alert you via Slack using this script.
You’ll need to create a contact for Slack and two commands that will send messages to it. You’ll store this config in a file named slack.cfg, in the same folder as the previous config files. Create it for editing by running the following command:
- sudo nano /usr/local/nagios/etc/objects/postgresql/slack.cfg
Add the following lines:
define contact {
      contact_name                             slack
      alias                                    Slack
      service_notification_period              24x7
      host_notification_period                 24x7
      service_notification_options             w,u,c,f,s,r
      host_notification_options                d,u,r,f,s
      service_notification_commands            notify-service-by-slack
      host_notification_commands               notify-host-by-slack
}

define command {
      command_name     notify-service-by-slack
      command_line     /usr/local/nagios/libexec/slack.pl -field slack_channel=#service_alerts_channel
}

define command {
      command_name     notify-host-by-slack
      command_line     /usr/local/nagios/libexec/slack.pl -field slack_channel=#host_alerts_channel
}
Here you define a contact named slack, state that it can be contacted anytime and specify which commands to use for notifying service and host related events. Those two commands are defined after it and call the script you have just configured. You’ll need to replace service_alerts_channel and host_alerts_channel with the names of the channels where you want to receive service and host messages, respectively. If preferred, you can use the same channel names.
Similarly to the service creation in the last step, setting service and host notification options on the contact is crucial, because it governs what kind of alerts the contact will receive. Omitting those options would result in sending out notifications only when manually triggered from the web interface.
When you are done with editing, save and close the file.
To enable alerting via the slack contact you just defined, you’ll need to add it to the admin contact group, defined in the contacts.cfg config file, located under /usr/local/nagios/etc/objects/. Open it for editing by running the following command:
- sudo nano /usr/local/nagios/etc/objects/contacts.cfg
Find the config block that looks like this:
define contactgroup {

    contactgroup_name       admins
    alias                   Nagios Administrators
    members                 nagiosadmin
}
Add slack to the list of members, like so:
define contactgroup {

    contactgroup_name       admins
    alias                   Nagios Administrators
    members                 nagiosadmin,slack
}
Save and close the file.
By default when running scripts, Nagios does not make host and service information available via environment variables, which is what the Slack script requires in order to send meaningful messages. To remedy this, you’ll need to set the enable_environment_macros setting in nagios.cfg to 1. Open it for editing by running the following command:
- sudo nano /usr/local/nagios/etc/nagios.cfg
Find the line that looks like this:
enable_environment_macros=0
Change the value to 1, like so:
enable_environment_macros=1
Save and close the file.
Test the validity of the Nagios configuration by running the following command:
- sudo /usr/local/nagios/bin/nagios -v /usr/local/nagios/etc/nagios.cfg
The end of the output will look like:
OutputTotal Warnings: 0
Total Errors:   0

Things look okay - No serious problems were detected during the pre-flight check
Proceed to restart Nagios by running the following command:
- sudo systemctl restart nagios
To test the Slack integration, you’ll send out a custom notification via the web interface. Reload the Nagios Services status page in your browser. Press on the PostgreSQL Backends service and press on Send custom service notification on the right when the page loads.
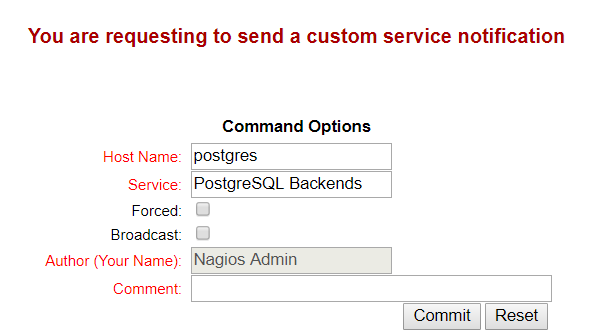
Type in a comment of your choice and press on Commit, and then press on Done. You’ll immediately receive a new message in Slack.

You have now integrated Slack with Nagios, so you’ll receive messages about critical events and status changes immediately. You’ve also tested the integration by manually triggering an event from within Nagios.
Conclusion
You now have Nagios Core configured to watch over your managed PostgreSQL database and report any status changes and events to Slack, so you’ll always be in the loop of what is happening to your database. This will allow you to swiftly react in case of an emergency, because you’ll be getting the status feed in real time.
If you’d like to learn more about the features of check_postgres, check out its docs, where you’ll find a lot more commands that you can possibly use.
For more information about what you can do with your PostgreSQL Managed Database, visit the product docs.
Thanks for learning with the DigitalOcean Community. Check out our offerings for compute, storage, networking, and managed databases.
About the author(s)
Expert in cloud topics including Kafka, Kubernetes, and Ubuntu.
Former Senior Technical Editor at DigitalOcean, with a strong focus on DevOps and System Administration content. Areas of expertise include Terraform, PyTorch, Python, and Django.
Still looking for an answer?
This textbox defaults to using Markdown to format your answer.
You can type !ref in this text area to quickly search our full set of tutorials, documentation & marketplace offerings and insert the link!
Hi
Did you know if there is an docker configured for monitoring remote Postgres on dockerhub ? Regards
 This work is licensed under a Creative Commons Attribution-NonCommercial- ShareAlike 4.0 International License.
Become a contributor for community
Get paid to write technical tutorials and select a tech-focused charity to receive a matching donation.

DigitalOcean Documentation
Full documentation for every DigitalOcean product.

Resources for startups and AI-native businesses
The Wave has everything you need to know about building a business, from raising funding to marketing your product.
The developer cloud
Scale up as you grow — whether you're running one virtual machine or ten thousand.

Start building today
From GPU-powered inference and Kubernetes to managed databases and storage, get everything you need to build, scale, and deploy intelligent applications.
