By Vadym Kalsin and Kathryn Hancox
Not using Ubuntu 18.04?
Choose a different version or distribution.
The author selected the Open Source Initiative to receive a donation as part of the Write for DOnations program.
Introduction
Nagios is a popular open-source monitoring system. It keeps an inventory of your servers and monitors them so you know your critical services are up and running. Using a monitoring system like Nagios is an essential tool for any production environment, because by monitoring uptime, CPU usage, or disk space, you can head off problems before they occur, or before your users call you.
In this tutorial, you’ll install Nagios 4 and configure it so you can monitor host resources via Nagios’ web interface. You’ll also set up the Nagios Remote Plugin Executor (NRPE), which runs as an agent on remote hosts so you can monitor their resources.
Prerequisites
To follow this tutorial, you will need:
- Two Ubuntu 18.04 servers set up by following our Initial Server Setup Guide for Ubuntu 18.04, including a non-root user with sudo privileges and a firewall configured with
ufw. On one server, you will install Nagios; this tutorial will refer to this as the Nagios server. It will monitor your second server; this second server will be referred to as the second Ubuntu server. - The server that will run the Nagios server needs Apache and PHP installed. Follow this guide to configure those on one of your servers. You can skip the MySQL steps in that tutorial.
Typically, Nagios runs behind a hardware firewall or VPN. If your Nagios server is exposed to the public internet, you should secure the Nagios web interface by installing a TLS/SSL certificate. This is optional but strongly encouraged. You can follow the Let’s Encrypt on Ubuntu 18.04 guide to obtain the free TLS/SSL certificate.
This tutorial assumes that your servers have private networking enabled so that monitoring happens on the private network rather than the public network. If you don’t have private networking enabled, you can still follow this tutorial by replacing all the references to private IP addresses with public IP addresses.
Step 1 — Installing Nagios 4
There are multiple ways to install Nagios, but you’ll install Nagios and its components from source to ensure you get the latest features, security updates, and bug fixes.
Log in to your server that runs Apache. In this tutorial, we’ll call this the Nagios server:
- ssh sammy@your_nagios_server_ip
Because you’re building Nagios and its components from source, you must install a few development libraries to complete the build, including compilers, development headers, and OpenSSL.
Update your package lists to ensure you can download the latest versions of the prerequisites:
- sudo apt update
Then install the required packages:
- sudo apt install autoconf gcc make unzip libgd-dev libmcrypt-dev libssl-dev dc snmp libnet-snmp-perl gettext
With the prerequisites installed, you can install Nagios itself. Download the source code for the latest stable release of Nagios Core. Go to the Nagios downloads page, and click the Skip to download link below the form. Copy the link address for the latest stable release so you can download it to your Nagios server.
Download the release to your home directory with the curl command:
- cd ~
- curl -L -O https://github.com/NagiosEnterprises/nagioscore/archive/nagios-4.4.4.tar.gz
Extract the Nagios archive:
- tar zxf nagios-4.4.4.tar.gz
Then change to the extracted directory:
- cd nagioscore-nagios-4.4.4
Before building Nagios, run the configure script and specify the Apache configs directory:
- ./configure --with-httpd-conf=/etc/apache2/sites-enabled
Note: If you want Nagios to send emails using Postfix, you must install Postfix and configure Nagios to use it by adding --with-mail=/usr/sbin/sendmail to the configure command. We won’t cover Postfix in this tutorial, but if you choose to use Postfix and Nagios later, you’ll need to reconfigure and reinstall Nagios to use Postfix support.
You’ll see the following output from the configure command:
Output*** Configuration summary for nagios 4.4.4 2019-07-29 ***:

 General Options:
 -------------------------
        Nagios executable:  nagios
        Nagios user/group:  nagios,nagios
       Command user/group:  nagios,nagios
             Event Broker:  yes
        Install ${prefix}:  /usr/local/nagios
    Install ${includedir}:  /usr/local/nagios/include/nagios
                Lock file:  /run/nagios.lock
   Check result directory:  /usr/local/nagios/var/spool/checkresults
           Init directory:  /lib/systemd/system
  Apache conf.d directory:  /etc/apache2/sites-enabled
             Mail program:  /bin/mail
                  Host OS:  linux-gnu
          IOBroker Method:  epoll

 Web Interface Options:
 ------------------------
                 HTML URL:  http://localhost/nagios/
                  CGI URL:  http://localhost/nagios/cgi-bin/
 Traceroute (used by WAP):


Review the options above for accuracy.  If they look okay,
type 'make all' to compile the main program and CGIs.
Now compile Nagios with this command:
- make all
Next create a nagios user and nagios group. They will be used to run the Nagios process:
- sudo make install-groups-users
Now run these make commands to install Nagios binary files, service files, and its sample configuration files:
- sudo make install
- sudo make install-daemoninit
- sudo make install-commandmode
- sudo make install-config
You’ll use Apache to serve Nagios’ web interface, so run the following to install the Apache configuration files and configure its settings:
- sudo make install-webconf
Enable the Apache rewrite and cgi modules with the a2enmod command:
- sudo a2enmod rewrite
- sudo a2enmod cgi
In order to issue external commands via the web interface to Nagios, add the web server user, www-data, to the nagios group:
- sudo usermod -a -G nagios www-data
Use the htpasswd command to create an admin user called nagiosadmin that can access the Nagios web interface:
- sudo htpasswd -c /usr/local/nagios/etc/htpasswd.users nagiosadmin
Enter a password at the prompt. Remember this password, as you will need it to access the Nagios web interface.
Warning: If you create a user with a name other than nagiosadmin, you will need to edit /usr/local/nagios/etc/cgi.cfg and change all the nagiosadmin references to the user you created.
Restart Apache to load the new Apache configuration:
- sudo systemctl restart apache2
You’ve now installed Nagios. But for this to work, it is necessary to install the Nagios Plugins, which you’ll cover in the next step.
Step 2 — Installing the Nagios Plugins
Nagios needs plugins to operate properly. The official Nagios Plugins package contains over 50 plugins that allow you to monitor basic services such as uptime, disk usage, swap usage, NTP, and others.
Let’s install the the plugins bundle.
You can find the latest version of the Nagios Plugins on the official site.
Download it to your home directory with curl:
- cd ~
- curl -L -O https://nagios-plugins.org/download/nagios-plugins-2.2.1.tar.gz
Extract the NRPE archive and navigate into the extracted directory:
- tar zxf nagios-plugins-2.2.1.tar.gz
- cd nagios-plugins-2.2.1
Next configure their installation:
- ./configure
Now build and install the plugins:
- make
- sudo make install
Now the plugins are installed, but you need one more plugin for monitoring remote servers. Let’s install it next.
Step 3 — Installing the check_nrpe Plugin
Nagios monitors remote hosts using the Nagios Remote Plugin Executor, or NRPE. It consists of two pieces:
- The
check_nrpeplugin that the Nagios server uses. - The NRPE daemon, which runs on the remote hosts and sends data to the Nagios server.
Let’s install the check_nrpe plugin on our Nagios server.
Find the download URL for the latest stable release of NRPE at the GitHub page.
Download it to your home directory with curl:
- cd ~
- curl -L -O https://github.com/NagiosEnterprises/nrpe/releases/download/nrpe-3.2.1/nrpe-3.2.1.tar.gz
Extract the NRPE archive:
- tar zxf nrpe-3.2.1.tar.gz
Then change to the extracted directory:
- cd nrpe-3.2.1
Configure the check_nrpe plugin:
- ./configure
Now build and install check_nrpe plugin:
- make check_nrpe
- sudo make install-plugin
Let’s configure the Nagios server next.
Step 4 — Configuring Nagios
Now let’s perform the initial Nagios configuration, which involves editing some configuration files. You only need to perform this section once on your Nagios server.
Open the main Nagios configuration file in your preferred text editor. Here, you’ll use nano:
- sudo nano /usr/local/nagios/etc/nagios.cfg
Find this line in the file:
...
#cfg_dir=/usr/local/nagios/etc/servers
...
Uncomment this line by deleting the # character from the front of the line:
cfg_dir=/usr/local/nagios/etc/servers
Save and close nagios.cfg by pressing CTRL+X, followed by Y, and then ENTER (if you’re using nano).
Now create the directory that will store the configuration file for each server that you will monitor:
- sudo mkdir /usr/local/nagios/etc/servers
Open the Nagios contacts configuration in your text editor:
- sudo nano /usr/local/nagios/etc/objects/contacts.cfg
Find the email directive and replace its value with your own email address:
...
define contact{
        contact_name                    nagiosadmin             ; Short name of user
        use                             generic-contact         ; Inherit default values from generic-contact template (defined above)
        alias                           Nagios Admin            ; Full name of user
        email                           your_email@your_domain.com        ; <<***** CHANGE THIS TO YOUR EMAIL ADDRESS ******
...
Save and exit the editor.
Next, add a new command to your Nagios configuration that lets you use the check_nrpe command in Nagios service definitions. Open the file /usr/local/nagios/etc/objects/commands.cfg in your editor:
- sudo nano /usr/local/nagios/etc/objects/commands.cfg
Add the following to the end of the file to define a new command called check_nrpe:
...
define command{
        command_name check_nrpe
        command_line $USER1$/check_nrpe -H $HOSTADDRESS$ -c $ARG1$
}
This defines the name and specifies the command-line options to execute the plugin.
Save and exit the editor.
Then start Nagios and enable it to start when the server boots:
- sudo systemctl start nagios
Nagios is now running, so let’s log in to its web interface.
Step 5 — Accessing the Nagios Web Interface
Open your favorite web browser, and go to your Nagios server by visiting http://nagios_server_public_ip/nagios.
Enter the login credentials for the web interface in the popup that appears. Use nagiosadmin for the username, and the password you created for that user.
After authenticating, you will see the default Nagios home page. Click on the Hosts link in the left navigation bar to see which hosts Nagios is monitoring:
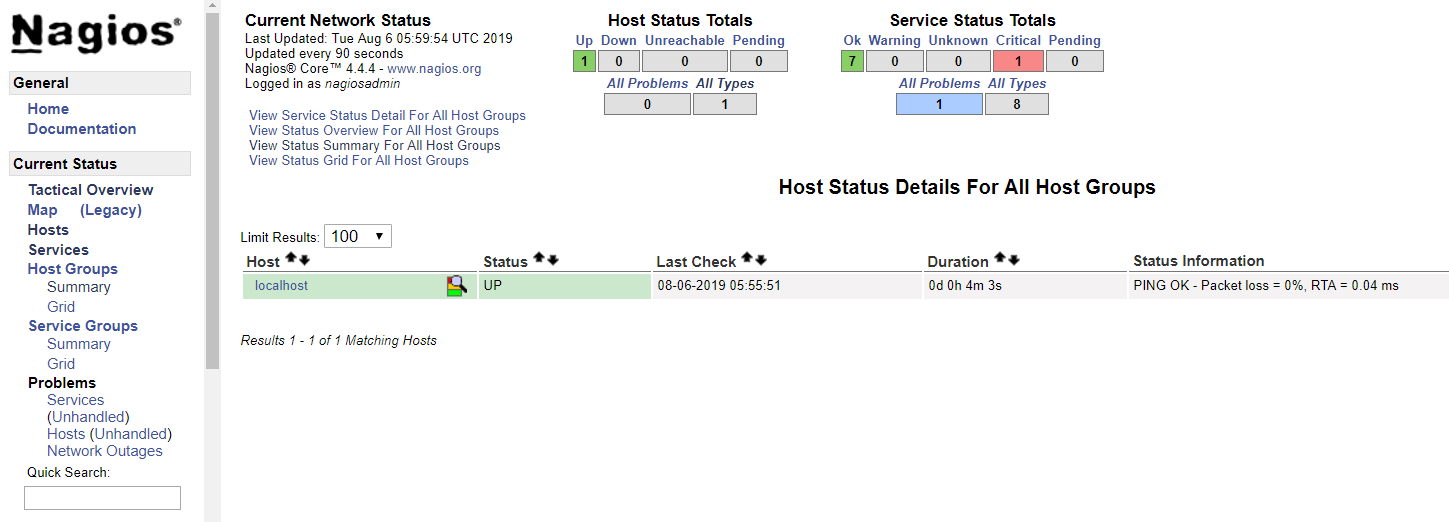
As you can see, Nagios is monitoring only “localhost”, or itself.
Let’s monitor our other server with Nagios,
Step 6 — Installing Nagios Plugins and NRPE Daemon on a Host
Let’s add a new host so Nagios can monitor it. You’ll install the Nagios Remote Plugin Executor (NRPE) on the remote host, install some plugins, and then configure the Nagios server to monitor this host.
Log in to the second server, which we’ll call the second Ubuntu server:
- ssh sammy@your_monitored_server_ip
First create a nagios user which will run the NRPE agent:
- sudo useradd nagios
You’ll install NRPE from source, which means you’ll need the same development libraries you installed on the Nagios server in Step 1. Update your package sources and install the NRPE prerequisites:
- sudo apt update
- sudo apt install autoconf gcc libmcrypt-dev make libssl-dev wget dc build-essential gettext
NRPE requires that Nagios Plugins is installed on the remote host. Let’s install this package from source.
Find the latest release of Nagios Plugins from the downloads page.
Download Nagios Plugins to your home directory with curl:
- cd ~
- curl -L -O https://nagios-plugins.org/download/nagios-plugins-2.2.1.tar.gz
Extract the Nagios Plugins archive and change to the extracted directory:
- tar zxf nagios-plugins-2.2.1.tar.gz
- cd nagios-plugins-2.2.1
Before building Nagios Plugins, configure them with the following command:
- ./configure
Now compile the plugins:
- make
Then install them by running:
- sudo make install
Next, install NRPE daemon. Find the download URL for the latest stable release of NRPE at the GitHub page just like you did in Step 3. Download the latest stable release of NRPE to your monitored server’s home directory with curl:
- cd ~
- curl -L -O https://github.com/NagiosEnterprises/nrpe/releases/download/nrpe-3.2.1/nrpe-3.2.1.tar.gz
Extract the NRPE archive with this command:
- tar zxf nrpe-3.2.1.tar.gz
Then change to the extracted directory:
- cd nrpe-3.2.1
Configure NRPE:
- ./configure
Now build and install NRPE and its startup script with these commands:
- make nrpe
- sudo make install-daemon
- sudo make install-config
- sudo make install-init
Now, let’s update the NRPE configuration file and add some basic checks that Nagios can monitor.
First, let’s monitor the disk usage of this server. Use the df -h command to look for the root filesystem. You’ll use this filesystem name in the NRPE configuration:
- df -h /
You’ll see output similar to this:
OutputFilesystem      Size  Used Avail Use% Mounted on
/dev/vda1        25G  1.4G   23G   6% /
Now open /usr/local/nagios/etc/nrpe.cfg file in your editor:
- sudo nano /usr/local/nagios/etc/nrpe.cfg
The NRPE configuration file is very long and full of comments. There are a few lines that you will need to find and modify:
- server_address: Set to the private IP address of the monitored server.
- allowed_hosts: Add the private IP address of your Nagios server to the comma-delimited list.
- command[check_hda1]: Change
/dev/hda1to whatever your root filesystem is called.
Locate these settings and alter them appropriately:
...
server_address=second_ubuntu_server_private_ip
...
allowed_hosts=127.0.0.1,::1,your_nagios_server_private_ip
...
command[check_vda1]=/usr/local/nagios/libexec/check_disk -w 20% -c 10% -p /dev/vda1
...
Save and exit the editor. Now you can start NRPE:
- sudo systemctl start nrpe.service
Ensure that the service is running by checking its status:
- sudo systemctl status nrpe.service
You’ll see the following output:
Output...
Aug 01 06:28:31 client systemd[1]: Started Nagios Remote Plugin Executor.
Aug 01 06:28:31 client nrpe[8021]: Starting up daemon
Aug 01 06:28:31 client nrpe[8021]: Server listening on 0.0.0.0 port 5666.
Aug 01 06:28:31 client nrpe[8021]: Server listening on :: port 5666.
Aug 01 06:28:31 client nrpe[8021]: Listening for connections on port 5666
Aug 01 06:28:31 client nrpe[8021]: Allowing connections from: 127.0.0.1,::1,165.22.212.38
Next, allow access to port 5666 through the firewall. If you are using UFW, configure it to allow TCP connections to port 5666 with the following command:
- sudo ufw allow 5666/tcp
You can learn more about UFW in How To Set Up a Firewall with UFW on Ubuntu 18.04.
Now you can check the communication with the remote NRPE server. Run the following command on the Nagios server:
- /usr/local/nagios/libexec/check_nrpe -H second_ubuntu_server_ip
You’ll see the following output:
OutputNRPE v3.2.1
Repeat the steps in this section for each additional server you want to monitor.
Once you are done installing and configuring NRPE on the hosts that you want to monitor, you will have to add these hosts to your Nagios server configuration before it will start monitoring them. Let’s do that next.
Step 7 — Monitoring Hosts with Nagios
To monitor your hosts with Nagios, you’ll add configuration files for each host specifying what you want to monitor. You can then view those hosts in the Nagios web interface.
On your Nagios server, create a new configuration file for each of the remote hosts that you want to monitor in /usr/local/nagios/etc/servers/. Replace the highlighted word, monitored_server_host_name with the name of your host:
- sudo nano /usr/local/nagios/etc/servers/your_monitored_server_host_name.cfg
Add the following host definition, replacing the host_name value with your remote hostname, the alias value with a description of the host, and the address value with the private IP address of the remote host:
define host {
        use                             linux-server
        host_name                       your_monitored_server_host_name
        alias                           My client server
        address                         your_monitored_server_private_ip
        max_check_attempts              5
        check_period                    24x7
        notification_interval           30
        notification_period             24x7
}
With this configuration, Nagios will only tell you if the host is up or down. Let’s add some services to monitor.
First, add this block to monitor load average:
define service {
        use                             generic-service
        host_name                       your_monitored_server_host_name
        service_description             Load average
        check_command                   check_nrpe!check_load
}
The use generic-service directive tells Nagios to inherit the values of a service template called generic-service, which is predefined by Nagios.
Next, add this block to monitor disk usage:
define service {
        use                             generic-service
        host_name                       your_monitored_server_host_name
        service_description             /dev/vda1 free space
        check_command                   check_nrpe!check_vda1
}
Now save and quit. Restart the Nagios service to put any changes into effect:
- sudo systemctl restart nagios
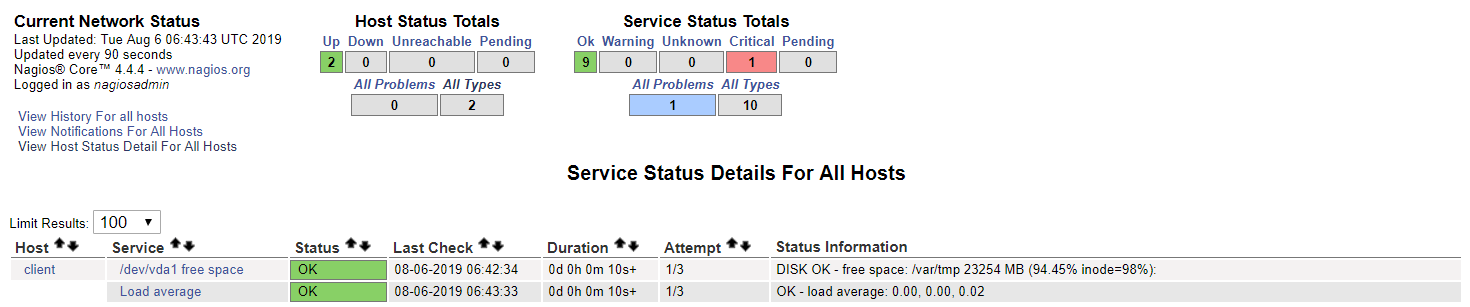
After several minutes, Nagios will check the new hosts and you’ll see them in the Nagios web interface. Click on the Services link in the left navigation bar to see all of your monitored hosts and services.
Conclusion
You’ve installed Nagios on a server and configured it to monitor load average and disk usage of at least one remote machine.
Now that you’re monitoring a host and some of its services, you can start using Nagios to monitor your mission-critical services. You can use Nagios to set up notifications for critical events. For example, you can receive an email when your disk utilization reaches a warning or critical threshold, or a notification when your main website is down. This way you can resolve the situation promptly, or even before a problem occurs.
Thanks for learning with the DigitalOcean Community. Check out our offerings for compute, storage, networking, and managed databases.
About the author(s)
Monitoring engineer
Former Senior Technical Editor at DigitalOcean, with a strong focus on DevOps and System Administration content. Areas of expertise include Terraform, PyTorch, Python, and Django.
Still looking for an answer?
This textbox defaults to using Markdown to format your answer.
You can type !ref in this text area to quickly search our full set of tutorials, documentation & marketplace offerings and insert the link!
Hello, I always love to use Digital ocean before digging deeper as your style and way of writing is best for any technical from my vision and I feel trust when someone ask me to do a favor anytime. When I come to step five and login as you told the system opens like a text file as show below: The link I use: http://10.0.1.22/nagios/ the code shown: <?php // Allow specifying main window URL for permalinks, etc. $url = ‘main.php’;
if (“no” == “yes” && isset($_GET[‘corewindow’])) {
// The default window url may have been overridden with a permalink...
// Parse the URL and remove permalink option from base.
$a = parse_url($_GET['corewindow']);

// Build the base url.
$url = htmlentities($a['path']).'?';
$url = (isset($a['host'])) ? $a['scheme'].'://'.$a['host'].$url : '/'.$url;

$query = isset($a['query']) ? $a['query'] : '';
$pairs = explode('&', $query);
foreach ($pairs as $pair) {
	$v = explode('=', $pair);
	if (is_array($v)) {
		$key = urlencode($v[0]);
		$val = urlencode(isset($v[1]) ? $v[1] : '');
		$url .= "&$key=$val";
	}
}
if (preg_match("/^http:\/\/|^https:\/\/|^\//", $url) != 1)
All versions are same as explained even I know there is newer. and system is ubuntu 18.04LTS apache2, Would you please help?
Hello,
I’m having a problem in nrpe client. its shows NRPE: Unable to read output
$ /usr/local/nagios/libexec/check_nrpe -H <monitored_IP> -c check_hda1
$ NRPE: Unable to read output
Please help thank you. BTW i really love DigitalOcean :)
I had a terribly difficult time with these instructions with NRPE. Everything else was smooth. Both of my remote servers were getting a “NRPE: Unable to read output” status.
I ended up using a much simpler install instruction from Nagios directly: https://support.nagios.com/kb/article.php?id=8
Thanks for the nice write-up. I have noticed that for those whose servers are on different public IPs
,your_nagios_server_private_ip
should read
,your_nagios_server_public_ip
Hi,
I have setup all the things but when I am going to add client services on the server inside this location /usr/local/nagios/etc/servers/I have created my client file and added below content
define host { use test1 host_name testing alias demo address 192.168.1.83 max_check_attempts 5 check_period 24x7 notification_interval 30 notification_period 24x7 } define service { use generic-service host_name 192.168.1.83 service_description Load average check_command check_nrpe!check_load } define service { use generic-service host_name 192.168.1.83 service_description /dev/sda2 free space check_command check_nrpe!check_vda1 }
but when I am going to restart Nagios server then it’s given me an error
I think that this line should be uncomment: cfg_dir=/usr/local/nagios/etc/servers
on
/usr/local/nagios/etc/nagios.cfg
what a seamless guide !!
however here with the instruction that correctly reads:
command[check_hda1]: Change /dev/hda1 to whatever your root filesystem is called.
this below snippet highlights
command[check_vda1]
do not change it, do as the instruction says above.
command[check_vda1]=/usr/local/nagios/libexec/check_disk -w 20% -c 10% -p /dev/vda1
 This work is licensed under a Creative Commons Attribution-NonCommercial- ShareAlike 4.0 International License.
Become a contributor for community
Get paid to write technical tutorials and select a tech-focused charity to receive a matching donation.

DigitalOcean Documentation
Full documentation for every DigitalOcean product.

Resources for startups and AI-native businesses
The Wave has everything you need to know about building a business, from raising funding to marketing your product.
The developer cloud
Scale up as you grow — whether you're running one virtual machine or ten thousand.

Start building today
From GPU-powered inference and Kubernetes to managed databases and storage, get everything you need to build, scale, and deploy intelligent applications.
