By Marko Mudrinić and Brian Hogan

The author selected the Diversity in Tech fund to receive a donation as part of the Write for DOnations program.
Introduction
Prometheus is an open-source monitoring system that collects metrics from your services. Prometheus 2.0 brings many changes and improvements, such as a new time-series database, better resources usage, a new configuration format for alerts, and better Alertmanager discovery.
In this tutorial you’ll upgrade an existing Prometheus 1.x installation to Prometheus 2.0. The new time-series database in Prometheus 2.0, called tsdb, is incompatible with Prometheus 1.x, which means that you can’t read the data from your Prometheus 1.x instance with Prometheus 2. To get around that limitation, you’ll configure Prometheus 1.x to work as a read-only data store to make your old data available.
Prometheus 2 uses a new format for alert rules, so you’ll update your existing alert rules to the new format and work with Alertmanager.
Finally, you’ll use the web UI to make sure Prometheus is working as intended.
This tutorial covers only the most important changes. Before upgrading to the latest version, you should read Announcing Prometheus 2.0 to make sure you’re not affected by any of the other changes.
Prerequisites
To follow this tutorial you’ll need:
- One Ubuntu 16.04 server set up by following the Initial Server Setup with Ubuntu 16.04 tutorial, including a sudo non-root user and a firewall.
- Prometheus 1.x installed on your server, including the Prometheus Web UI. You can find out your Prometheus version by running the
prometheus -versioncommand. The output contains your Prometheus version as well as build information.
This tutorial assumes the following things about your Prometheus installation:
- You have created a prometheus user.
- You have created the directory
/etc/prometheuswhich holds Prometheus’s configuration files. - You have created the directory
/var/lib/prometheuswhich holds Prometheus’s data. - The
prometheusandpromtoolexecutables are located in/usr/local/bin. - You have configured Prometheus to run as a systemd service called
prometheus.
Step 1 — Upgrading Prometheus to 1.8.2
In order to access your old data using Prometheus 2.0, you’ll need to upgrade your current Prometheus installation to version 1.8.2 and then set up Prometheus 2.0 to read from the old one using the remote_read feature.
Using the prometheus -version command, check out your current Prometheus version. The output contains the version and build information. If you’re already running version 1.8.2 skip this step.
- prometheus -version
prometheus -version outputprometheus, version 1.7.1 (branch: master, revision: 3afb3fffa3a29c3de865e1172fb740442e9d0133)
  build user:       root@0aa1b7fc430d
  build date:       20170612-11:44:05
  go version:       go1.8.3
Before you go any farther, stop Prometheus so you can replace its files:
- sudo systemctl stop prometheus
You can find Prometheus 1.8.2 along with checksums on the project’s GitHub Releases page. You need a file called prometheus-1.8.2.linux-amd64.tar.gz. Using the following curl commands, download the Prometheus archive and checksum to your home directory:
- cd ~
- curl -LO https://github.com/prometheus/prometheus/releases/download/v1.8.2/prometheus-1.8.2.linux-amd64.tar.gz
- curl -LO https://github.com/prometheus/prometheus/releases/download/v1.8.2/sha256sums.txt
To make sure you have a genuine non-corrupted archive, use the sha256sum command to generate a checksum for the archive and compare it against a sha256sums.txt file.
- sha256sum -c sha256sums.txt 2>&1 | grep OK
Checksums checkprometheus-1.8.2.linux-amd64.tar.gz: OK
If you don’t see OK in the output, remove the downloaded archive and retrace the preceding steps to download it again.
Now, unpack the archive.
- tar xvf prometheus-1.8.2.linux-amd64.tar.gz
Copy the prometheus and promtool executables to the /usr/local/bin directory.
- sudo cp prometheus-1.8.2.linux-amd64/prometheus /usr/local/bin
- sudo cp prometheus-1.8.2.linux-amd64/promtool /usr/local/bin
Set the user and group ownership on the files to the prometheus user.
- sudo chown prometheus:prometheus /usr/local/bin/prometheus
- sudo chown prometheus:prometheus /usr/local/bin/promtool
Finally, start Prometheus to make sure it’s working as intended.
- sudo systemctl start prometheus
Lastly, check the service’s status.
- sudo systemctl status prometheus
You’ll see the following output:
Prometheus service status● prometheus.service - Prometheus
   Loaded: loaded (/etc/systemd/system/prometheus.service; enabled; vendor preset: enabled)
   Active: active (running) since Mon 2018-01-01 21:44:52 UTC; 2s ago
 Main PID: 1646 (prometheus)
    Tasks: 6
   Memory: 17.7M
      CPU: 333ms
   CGroup: /system.slice/prometheus.service
           └─1646 /usr/local/bin/prometheus -config.file /etc/prometheus/prometheus.yml -storage.local.path /var/lib/prometheus/
...
If the service status isn’t active, follow the on-screen logs and retrace the preceding steps to resolve the problem before continuing the tutorial.
Verify the Prometheus version to make sure you’re running version 1.8.2.
- prometheus -version
prometheus -version outputprometheus, version 1.8.2 (branch: HEAD, revision: 5211b96d4d1291c3dd1a569f711d3b301b635ecb)
  build user:       root@1412e937e4ad
  build date:       20171104-16:09:14
  go version:       go1.9.2
If you don’t see version 1.8.2 make sure you’ve downloaded the correct file and repeat the steps in this section.
Lastly, remove the files you downloaded, as you no longer need them.
- rm -rf prometheus-1.8.2.linux-amd64.tar.gz prometheus-1.8.2.linux-amd64
Next, you’ll reconfigure your existing installation so it doesn’t interfere with Prometheus 2.0 once you install it.
Step 2 — Configuring Prometheus 1.8.2 as a Separate Service
We want to keep Prometheus 1.8.2 around so we can access the old data, but we need to make sure that our old installation will not interfere with Prometheus 2 when we install it. To do so, we’ll append 1 to the name of all Prometheus-related directories and executables. For example, the prometheus executable will become prometheus1. We’ll also update the service definition and set it to run on a different port.
Before continuing, stop Prometheus, so you can rename the files and directories.
- sudo systemctl stop prometheus
In the /usr/local/bin directory, you’ll find two Prometheus executables—prometheus and promtool. Rename these to prometheus1 and promtool1 respectively:
- sudo mv /usr/local/bin/prometheus /usr/local/bin/prometheus1
- sudo mv /usr/local/bin/promtool /usr/local/bin/promtool1
Prometheus has two associated directories: /etc/prometheus , for storing configuration files, and /var/lib/prometheus, for storing data. Rename these directories as well.
- sudo mv /etc/prometheus /etc/prometheus1
- sudo mv /var/lib/prometheus /var/lib/prometheus1
We’re going to run Prometheus 1.8.2 as a read-only data store, so we don’t need it to collect any data from exporters. To ensure this, we’ll remove all the content from the configuration file using the following truncate command. Before removing the file’s contents, create a backup of the file, so you can use it later for configuring Prometheus 2.0.
- sudo cp /etc/prometheus1/prometheus.yml /etc/prometheus1/prometheus.yml.bak
Then empty the configuration file’s contents with truncate.
- sudo truncate -s 0 /etc/prometheus1/prometheus.yml
Next, rename the service file from prometheus to prometheus1.
- sudo mv /etc/systemd/system/prometheus.service /etc/systemd/system/prometheus1.service
Open the Prometheus service file in the text editor.
- sudo nano /etc/systemd/system/prometheus1.service
You’ll run Prometheus 2.0 on the default port of 9090, so change the port Prometheus 1.8.2 listens on to port 9089. Replace the ExecStart directive with the following configuration:
...
ExecStart=/usr/local/bin/prometheus1 \
	-config.file /etc/prometheus1/prometheus.yml \
	-storage.local.path /var/lib/prometheus1/ \
	-web.listen-address ":9089"
...
Save the file and close your text editor. Reload systemd to apply the changes.
- sudo systemctl daemon-reload
Start the prometheus1 service.
- sudo systemctl start prometheus1
To make sure it’s working as intended, check the service’s status.
- sudo systemctl status prometheus1
Just like before, the output contains information about the process, such as PID, status and more:
Service status output● prometheus1.service - Prometheus
   Loaded: loaded (/etc/systemd/system/prometheus1.service; disabled; vendor preset: enabled)
   Active: active (running) since Mon 2018-01-01 21:46:42 UTC; 3s ago
 Main PID: 1718 (prometheus1)
    Tasks: 6
   Memory: 35.7M
      CPU: 223ms
   CGroup: /system.slice/prometheus1.service
           └─1718 /usr/local/bin/prometheus1 -config.file /etc/prometheus1/prometheus.yml -storage.local.path /var/lib/prometheus1/
...
If the service status isn’t active, follow the on-screen logs and retrace the preceding steps to resolve the problem before continuing the tutorial.
Enable the service to make sure it’ll start when the system boots.
- sudo systemctl enable prometheus1
At this point Prometheus 1.8.2 won’t scrape any exporters. This will ensure data consistency once we set up Prometheus 2.0, which will use the current installation as a read-only data store for the old data. In the next step we’re going to install Prometheus 2.0 and use Prometheus 1.8.2 to access our old data.
Step 3 — Configuring Prometheus 2.0
In this step, we’ll configure Prometheus 2.0 to scrape exporters and use Prometheus 1.8.2 as a read-only data store so we can access our existing data.
Before continuing the tutorial, install Prometheus 2 by following Steps 1 and 2 of How To Install Prometheus on Ubuntu 16.04 tutorial.
Once you have installed Prometheus, create a new configuration file. The configuration file format hasn’t changed, so you can use your Prometheus 1.x configuration file with Prometheus 2. Copy the backup of your existing Prometheus configuration you created in the previous step into the /etc/prometheus/ directory.
- sudo cp /etc/prometheus1/prometheus.yml.bak /etc/prometheus/prometheus.yml
Set the user and group ownership on the newly-created configuration file to the prometheus user.
- sudo chown prometheus:prometheus /etc/prometheus/prometheus.yml
The only change you’ll make to this file is to tell Prometheus 2.0 to use Prometheus 1.8.2 as a read-only data store so you have access to the old data. Open the configuration file in the text editor.
- sudo nano /etc/prometheus/prometheus.yml
At end of the configuration file, add the remote_read directive which reads from a remote Prometheus instance. Tell it to read from localhst:9089, your Prometheus 1.8.2 instance:
...

remote_read:
	- url: http://localhost:9089/api/v1/read
Once you’re done, save the file and close your text editor.
Before running Prometheus 2.0 for the first time, we’ll update alert rules and configure Alertmanager to work with Prometheus. If you don’t use alert rules or Alertmanager, skip the next step.
Step 4 — Configuring Alerting (Optional)
Prometheus 1.x alert rules were defined using a custom syntax. As of version 2.0, you define alert rules using YAML. To make migration easier, Prometheus’ promtool command can convert old rule files to the new format. If you don’t use alert rules, you can skip this step.
First, copy all the rules you have from the /etc/prometheus1 directory to the /etc/prometheus directory.
- sudo cp /etc/prometheus1/*.rules /etc/prometheus/
Also, make sure you have promtool version 2.0 by running the following command:
- promtool --version
The output contains promtool version and build information.
promtool --versionpromtool, version 2.0.0 (branch: HEAD, revision: 0a74f98628a0463dddc90528220c94de5032d1a0)
  build user:       root@615b82cb36b6
  build date:       20171108-07:11:59
  go version:       go1.9.2
If the version isn’t 2.0, make sure you copied the promtool executable to the correct location.
Now, navigate to the /etc/prometheus directory.
- cd /etc/prometheus
Run the following promtool command for each .rules file you have in the directory:
- sudo promtool update rules file-name.rules
This generates a new file called file-name.rules.yml file from a provided file. If you see any error message on the screen, follow the on-screen logs to resolve the problem before continuing the tutorial.
Make sure the user and group ownership is set correctly on the files created by promtool.
- sudo chown prometheus:prometheus file-name.rules
Lastly, update the Prometheus configuration file to use your newly-created rule files instead of the old ones. Open the configuration file in your editor.
- sudo nano /etc/prometheus/prometheus.yml
Append the .yml suffix to every entry under the rule_files directive, like this:
...
rule_files:
  - alert1.rules.yml
  - alert2.rules.yml
...
Save the file and exit the editor.
Now remove the old alert rule files as they’re no longer needed.
- sudo rm alert1.rules alert2.rules
Next, let’s configure Prometheus to discover Alertmanager. The -alertmanager.url flag doesn’t exist anymore. Instead, Prometheus 2.0 introduced Alertmanager Service Discovery, which brings many new features and better integration with services such as Kubernetes. If you don’t use Alertmanager, skip the rest of this step.
Open the prometheus.yml file in your editor again:
- sudo nano /etc/prometheus/prometheus.yml
The following alerting directive instructs Prometheus to use Alertmanager running on the Droplet’s port :9093. You can add the following content anywhere in the file:
global:
...

alerting:
  alertmanagers:
  - static_configs:
    - targets:
      - alertmanager:9093

rule_files:
...
Save the file and close your text editor.
Prometheus is now able to use the alert rules and communicate with Alertmanager, and we’re ready to run it for the first time.
Step 5 — Running Prometheus 2.0
To be able to run Prometheus 2.0 as a service, we need to create a service file. We can start with the service file we used for Prometheus 1.8.2, as it’s mostly the same, other than the ExecStart command.
Create a new service file by copying the existing one:
- sudo cp /etc/systemd/system/prometheus1.service /etc/systemd/system/prometheus.service
Open the newly-created service file in your editor:
- sudo nano /etc/systemd/system/prometheus.service
Prometheus 2.0 brings several important changes in the flags system, including:
- Flags are now prefixed using double-dash (
--) instead of single-dash. - All
-storage.localand-storage.remoteflags have been removed and replaced with--storage.tsdbflags. - The
-alertmanager.urlhas been removed and replaced with Alertmanager Service Discovery, which is covered in the previous step.
Replace the ExecStart directive with the following one:
ExecStart=/usr/local/bin/prometheus \
    --config.file /etc/prometheus/prometheus.yml \
    --storage.tsdb.path /var/lib/prometheus/ \
    --web.console.templates=/etc/prometheus/consoles \
    --web.console.libraries=/etc/prometheus/console_libraries
The --config.file directive instructs Prometheus to use the prometheus.yml file in the /etc/prometheus directory. Instead of --storage.local.path we’ll use --storage.tsdb.path. Also, we have added two --web. flags, so we have access to the built-in Web templates.
Once you’re done, save the file and close your text editor.
Lastly, reload systemd, so you can use the newly-created service.
- sudo systemctl daemon-reload
Then start Prometheus:
- sudo systemctl start prometheus
Check the service’s status to make sure it’s working as intended.
- sudo systemctl status prometheus
Prometheus service status● prometheus.service - Prometheus
    Loaded: loaded (/etc/systemd/system/prometheus.service; enabled; vendor preset: enabled)
    Active: active (running) since Mon 2018-01-01 20:15:09 UTC; 1h 20min ago
  Main PID: 1947 (prometheus)
    Tasks: 7
    Memory: 54.3M
      CPU: 15.626s
    CGroup: /system.slice/prometheus.service
            └─1947 /usr/local/bin/prometheus --config.file /etc/prometheus/prometheus.yml --storage.tsdb.path /var/lib/prometheus/
...
If the service status isn’t active, follow the on-screen logs and retrace the preceding steps to resolve the problem before continuing the tutorial.
Now that you know the service works, enable it to start when the system boots:
- sudo systemctl enable prometheus
You can access the Prometheus’ Web UI by navigating to http://your_server_ip in your web browser and authenticating using the credentials you configured when you installed Prometheus. You’ll use the Web UI in the next step to make sure Prometheus is working as intended.
Step 6 — Testing Prometheus
Let’s make sure that Prometheus 2 is scraping all exporters as intended, and ensure it can access the data from the previous installation of Prometheus.
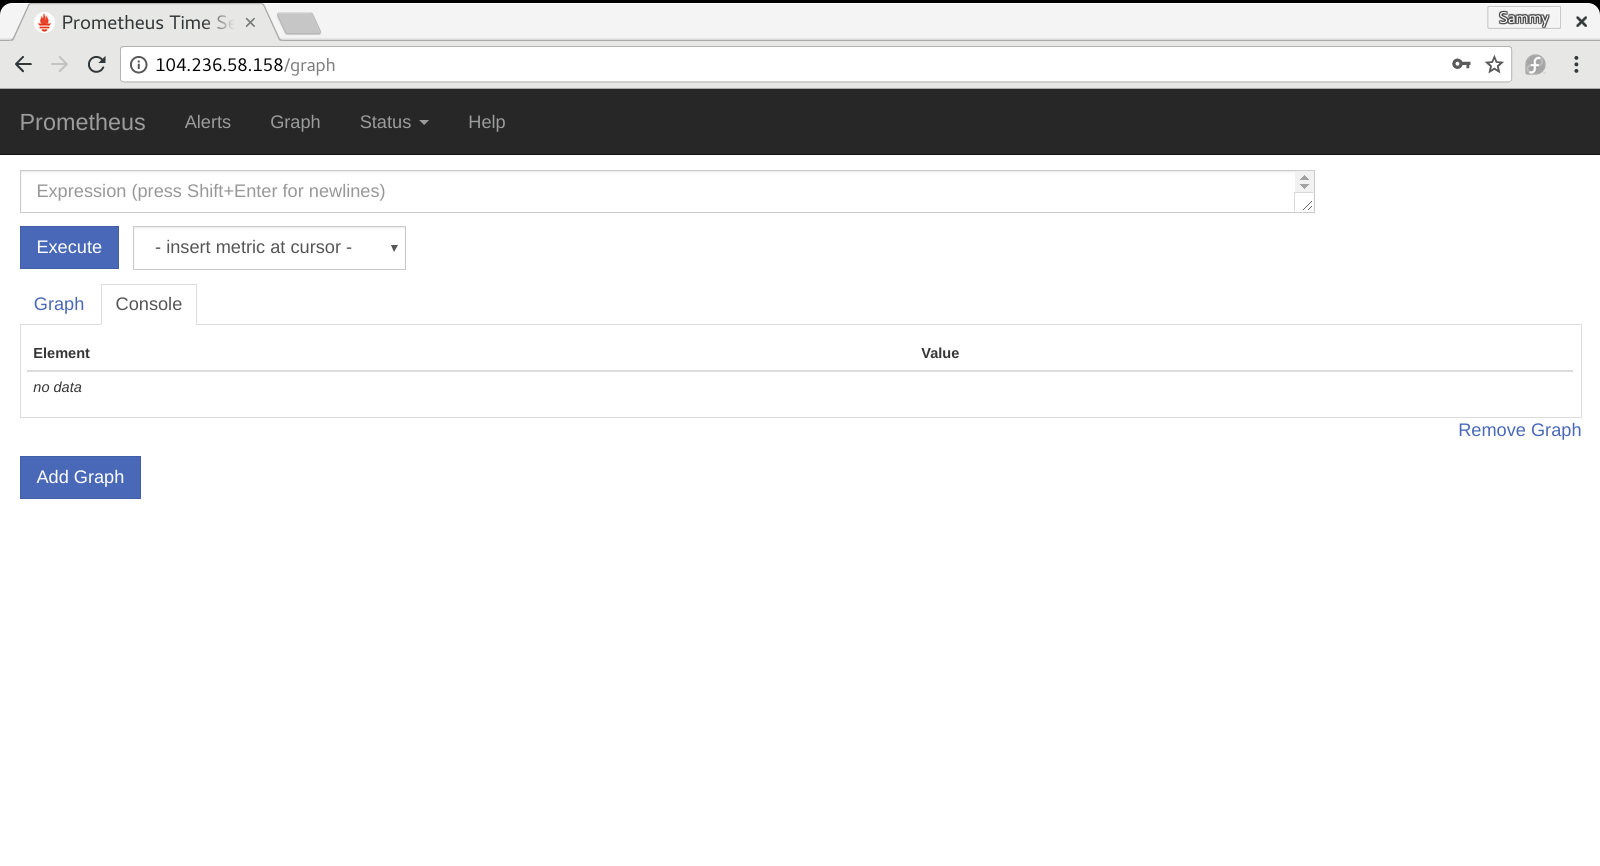
Navigate to http://your_server_ip in your web browser to access the Prometheus Web UI. You’ll be asked to enter the user name and password you configured when you installed Prometheus originally.
Once you enter the credentials, you’ll see the Graph page, where you can execute and visualize queries:
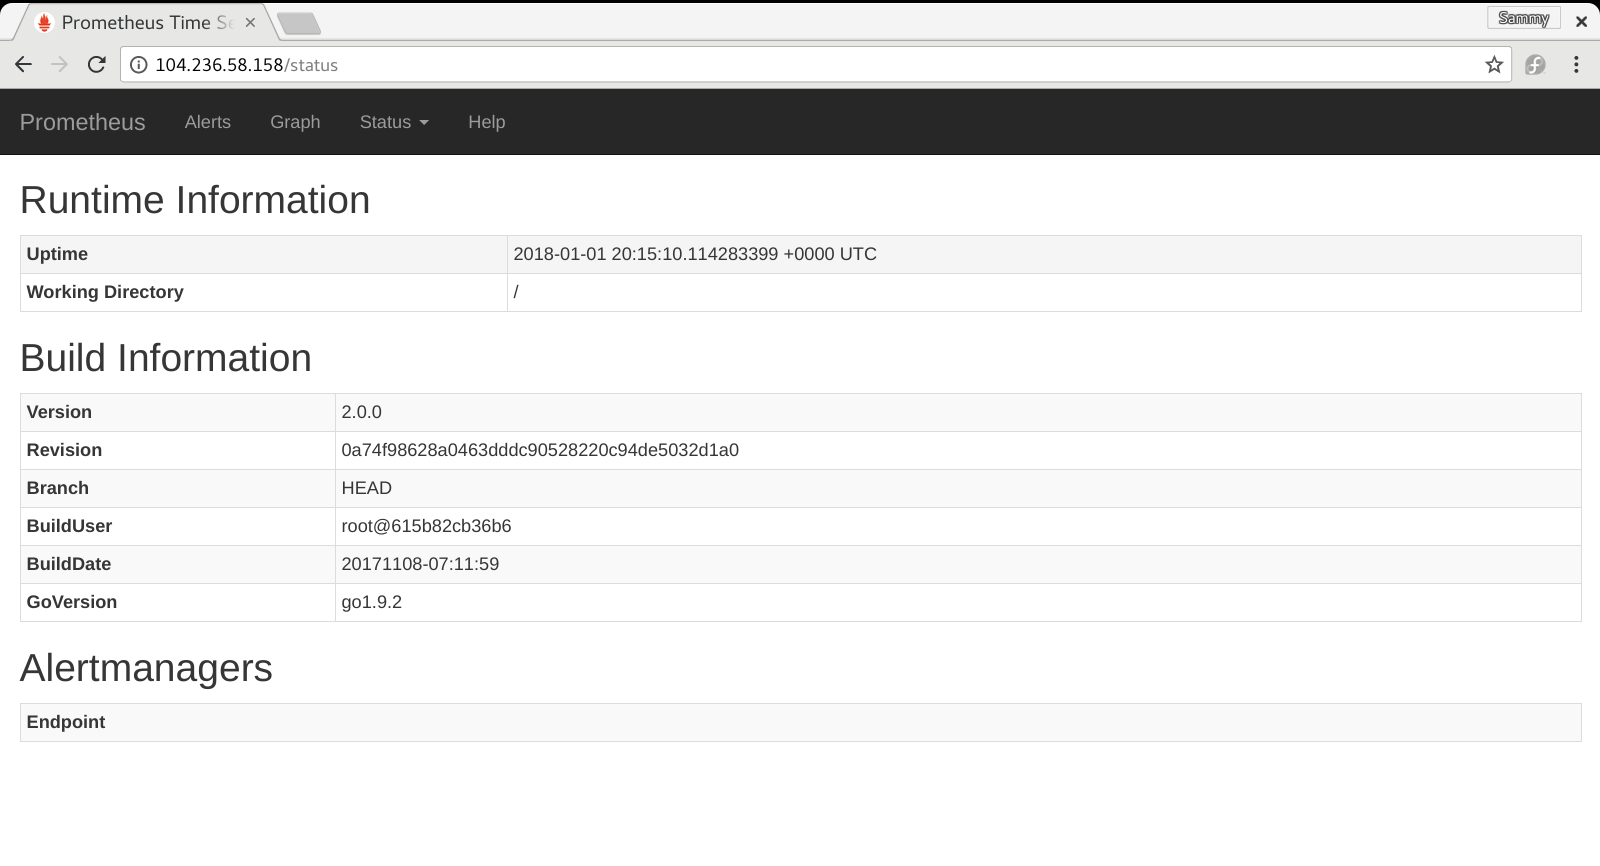
Before executing a query, let’s check Prometheus’ version and exporters status. Click on the Status link in the navigation bar and click the Runtime & Build Information button. You’ll see the page containing information about your Prometheus server.
Next, click on the Status link again, then click the Targets button to check that your exporters are running as intended. The web page contains details about your exporters, including if they up and running.
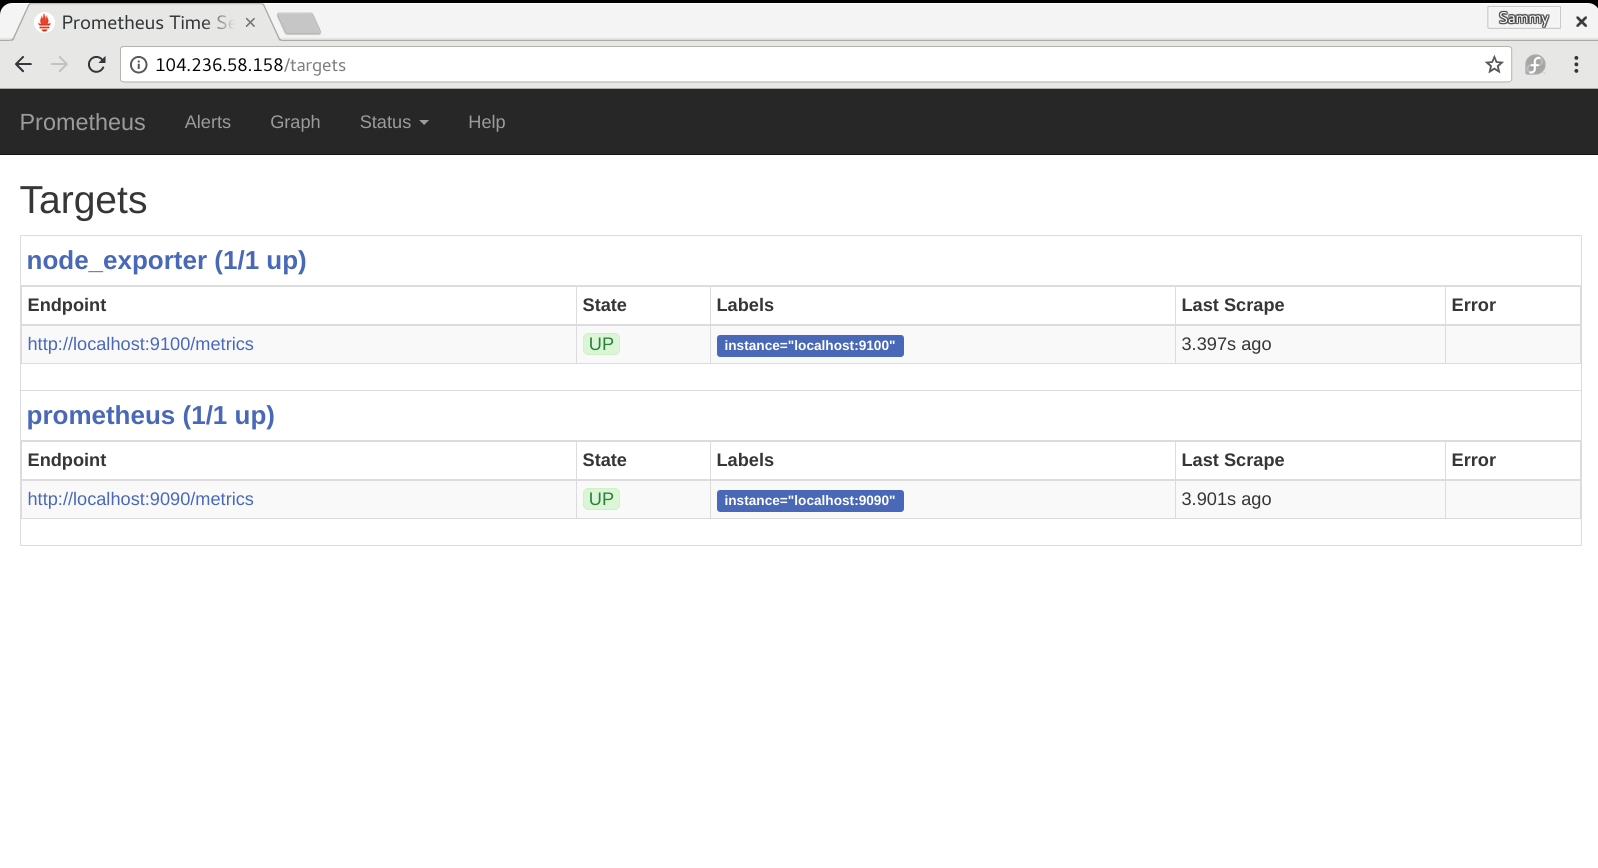
If you see any error, make sure to resolve it by following the on-screen instructions before continuing the tutorial.
You won’t see your Prometheus 1.8.2 data source, as it’s used as a data store instead as an exporter. So let’s ensure we can access both the old and new data. Click on the Graph button.
In the Expression field, type node_memory_MemAvailable/1024/1024 to get your server’s available memory in megabytes. Click on the Execute button.
You’ll see the results displayed on the screen:
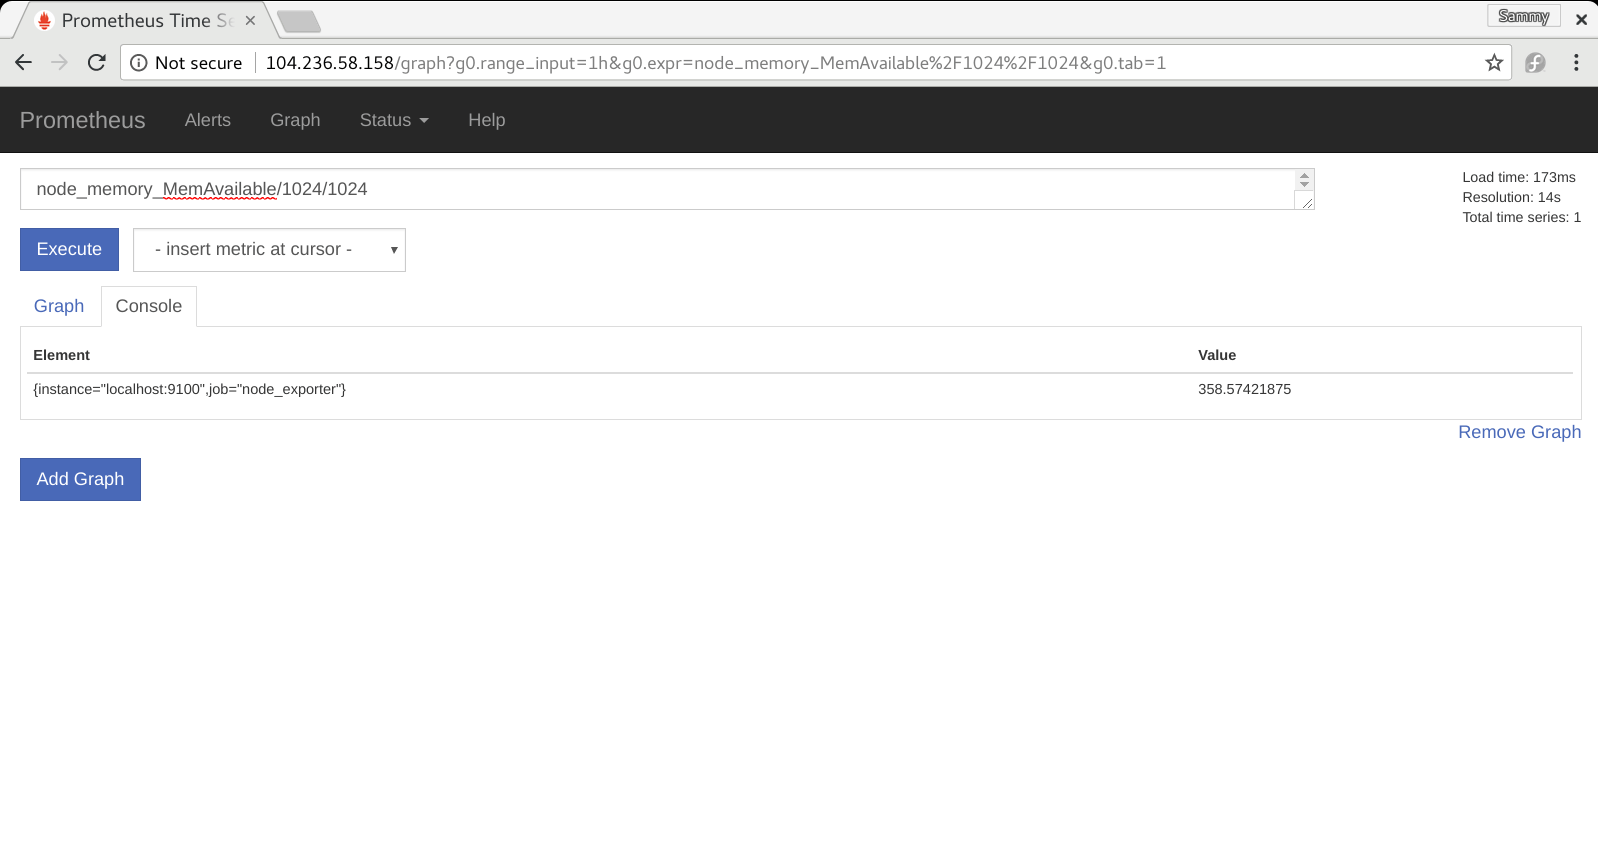
Click on the Graph tab to visualize available memory over time. On the graph, you should see the previous data, and after a break while Prometheus wasn’t working, the latest data.
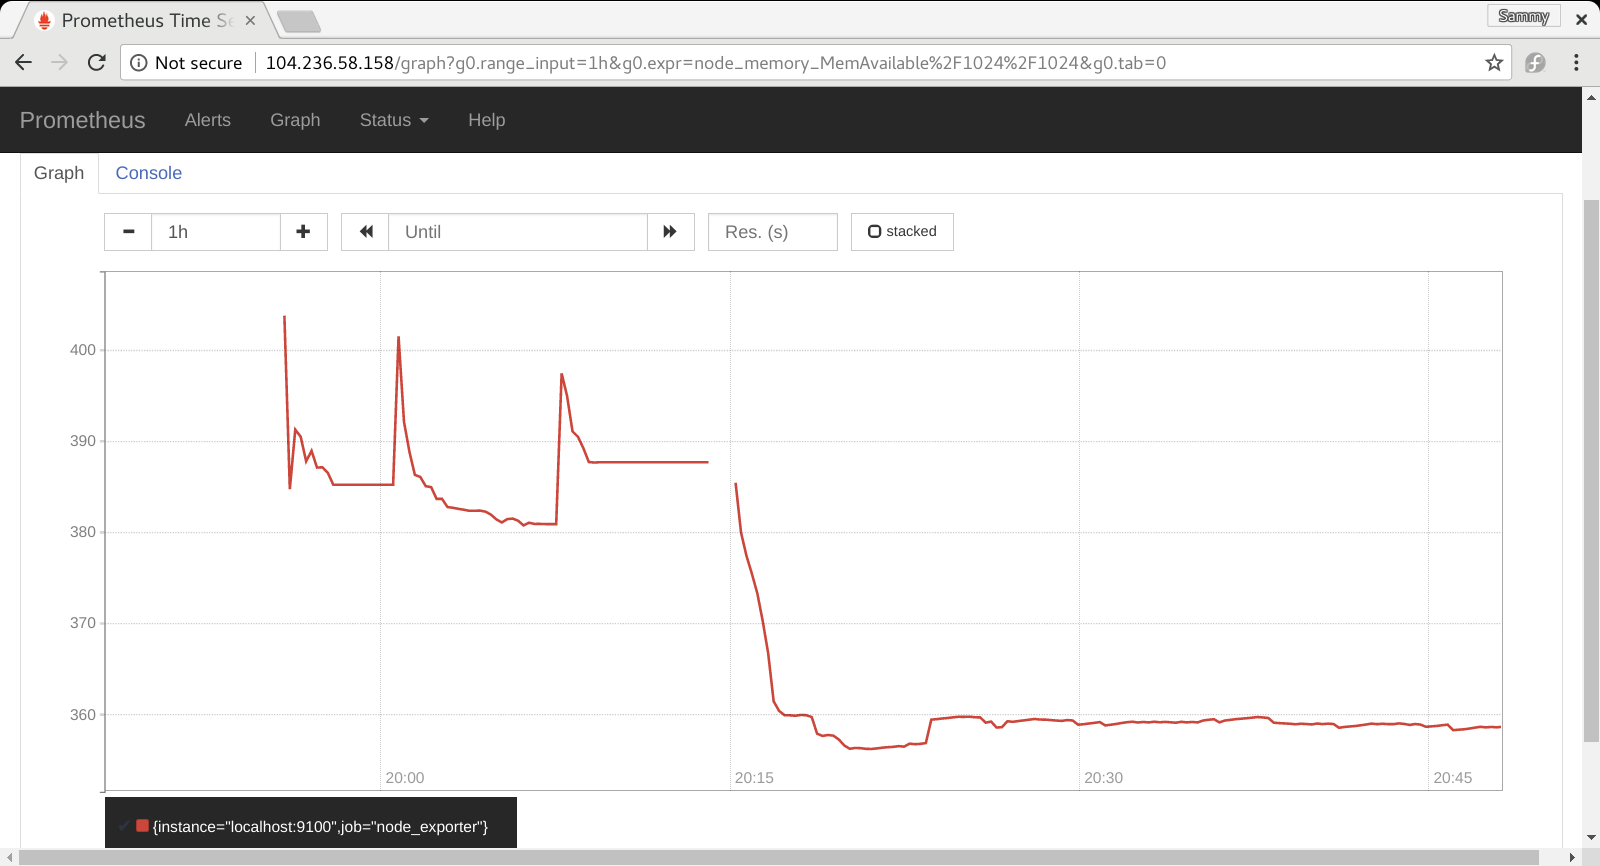
If you don’t see the old data, make sure Prometheus 1.8.2 is up by checking its service’s status, and that you configured Prometheus 2.0 to use it as a remote database.
You’ve verified that Prometheus is working and reporting data correctly. Now let’s look at how you can remove Prometheus 1.8.2 and the old data once it isn’t used anymore.
Step 7 — Removing The Old Data (Optional)
You may want to remove Prometheus 1.8.2 and your old data once you don’t need it anymore. Follow these steps to clean everything up.
Warning: This is an irreversible operation! Once you delete your old data, you’ll never be able to recover it unless you’ve backed it up.
First, remove the remote_read directive from the Prometheus 2 configuration file. Open the Prometheus 2.0 configuration file in your editor:
- sudo nano /etc/prometheus/prometheus.yml
Locate and remove the remote_read directive which should be at the end of the file:
remote_read:
	- url: http://localhost:9089/api/v1/read
Save the file and close your text editor. Restart Prometheus to apply the changes.
- sudo systemctl restart prometheus
Ensure the service is running properly:
- sudo systemctl status prometheus
Prometheus service status● prometheus.service - Prometheus
   Loaded: loaded (/etc/systemd/system/prometheus.service; enabled; vendor preset: enabled)
   Active: active (running) since Mon 2018-01-01 20:15:09 UTC; 1h 20min ago
 Main PID: 1947 (prometheus)
    Tasks: 7
   Memory: 54.3M
      CPU: 15.626s
   CGroup: /system.slice/prometheus.service
           └─1947 /usr/local/bin/prometheus --config.file /etc/prometheus/prometheus.yml --storage.tsdb.path /var/lib/prometheus/
...
If the service status isn’t active, follow the on-screen logs and retrace the preceding steps to resolve the problem before continuing the tutorial.
Next, disable and remove the prometheus1 service, and then clean up all the Prometheus 1.8.2 relevant directories and files.
Disable the service to make sure it doesn’t start up automatically:
- sudo systemctl disable prometheus1
Then stop the service:
- sudo systemctl stop prometheus1
No output indicates that the operation completed successfully.
Now remove the prometheus1 service file:
- sudo rm /etc/systemd/system/prometheus1.service
Finally, remove the leftover files as they’re no longer needed. First, remove the prometheus1 and promtool1 executables located in the /usr/local/bin directory.
- sudo rm /usr/local/bin/prometheus1 /usr/local/bin/promtool1
Then remove the /etc/prometheus1 and /var/lib/prometheus1 directories you used for storing data and configuration.
- sudo rm -r /etc/prometheus1 /var/lib/prometheus1
Prometheus 1.8.2 is now removed from your system and your old data is gone.
Conclusion
In this tutorial you upgraded Prometheus 1.x to Prometheus 2.0, updated all the rule files, and configured Prometheus to discover Alertmanager if it’s present.
Learn more about all the changes Prometheus 2.0 includes by reading the official Announcing Prometheus 2.0 post and the project’s changelog.
Thanks for learning with the DigitalOcean Community. Check out our offerings for compute, storage, networking, and managed databases.
About the author(s)
Software Developer @ Loodse. Former GSoC student with CNCF (Kubernetes). Kubicorn Project Maintainer. Gopher and student.
Managed the Write for DOnations program, wrote and edited community articles, and makes things on the Internet. Expertise in DevOps areas including Linux, Ubuntu, Debian, and more.
Still looking for an answer?
This textbox defaults to using Markdown to format your answer.
You can type !ref in this text area to quickly search our full set of tutorials, documentation & marketplace offerings and insert the link!
 This work is licensed under a Creative Commons Attribution-NonCommercial- ShareAlike 4.0 International License.
Become a contributor for community
Get paid to write technical tutorials and select a tech-focused charity to receive a matching donation.

DigitalOcean Documentation
Full documentation for every DigitalOcean product.

Resources for startups and AI-native businesses
The Wave has everything you need to know about building a business, from raising funding to marketing your product.
The developer cloud
Scale up as you grow — whether you're running one virtual machine or ten thousand.

Start building today
From GPU-powered inference and Kubernetes to managed databases and storage, get everything you need to build, scale, and deploy intelligent applications.
