- Log in to:
- Community
- DigitalOcean
- Sign up for:
- Community
- DigitalOcean
By Jordan Irabor

Introduction
As one advances through a software development career, concerns beyond writing code that works may arise. In the world of web development, it becomes pertinent to not only build functional software, but to also make it highly performant so that it can seamlessly deliver the desired experience while also using minimal resources.
Ordinarily, this would be quite a large task as one can’t make projections about the resource consumption properties of an application without tools to simulate and measure various parameters.
In this article, you will explore one of these tools: The Chrome Developer Tools. Specifically, you will examine the handiness of the Audits and Performance tab in evaluating web applications and discovering performance problems.
In order to make this a practical examination, you will be testing various techniques to seek out performance issues on a website and resolve them. This tutorial explores the Scotch.io website, but these steps can be applied to any website.
Prerequisites
To follow along with this tutorial, the Google Chrome browser installed on your computer.
Step 1 — Preparing the Browser
When improving the performance of a website or web application, there are two main aspects to consider:
- Load Performance
- Run-time Performance
This tutorial will focus more on Load Performance. Load Performance refers to the performance of the page when it is loading. The major objective is to identify performance issues that affect application speed and the overall user experience.
To begin testing Load Performance, you will start by setting up the audit.
Launch your Chrome browser and open a tab in Incognito mode by pressing COMMAND + SHIFT + N on macOS or CTRL + SHIFT + N on Windows or Linux. Once the Incognito browser is open, navigate to a website that you’d like to test.
Next, open the DevTools by pressing COMMAND + OPTION + I on macOS, or CTRL + SHIFT + I on Windows or Linux. If you’d like to change the location of the DevTools console, click on the three vertical dots on the tool bar and make a selection from the Dock Side option.
Once you’re happy with the console placement, switch over to the Audits tab. With the help of this tool, you will create a baseline to measure subsequent application changes, as well as receive insights on what changes will improve the application.
Note: The Audits tab may be hidden behind the More Panels arrow button.
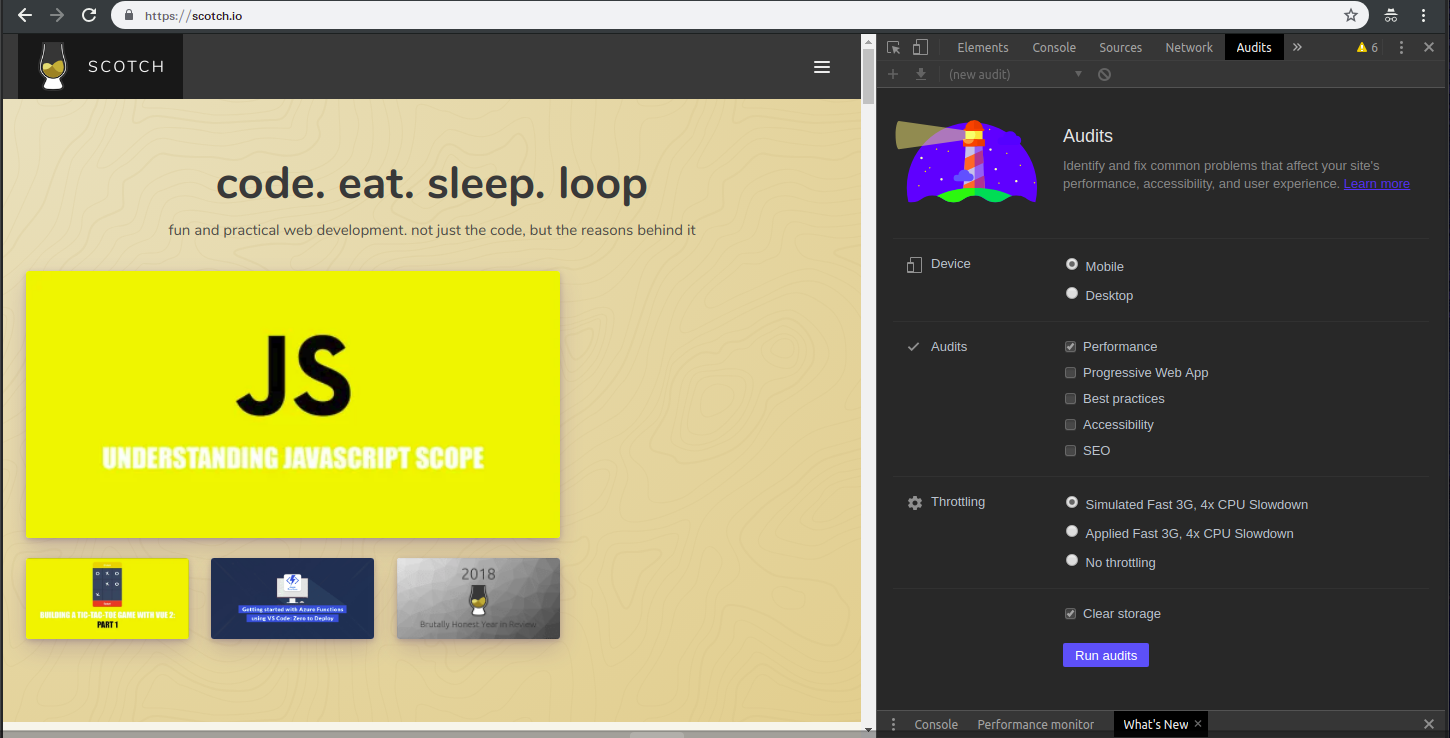
Your primary objective here is to identify performance bottlenecks on Scotch and optimize for better performance. A bottleneck, in software engineering, describes a situation where the capacity of an application is limited by a single component.
In the next step, you will perform an audit to look for performance bottlenecks.
Step 2 — Performing the Audit
When performing the audit, you will use a tool called Lighthouse. Lighthouse is an open-source automated tool for improving the quality of any web page in the areas of performance, accessibility, progressive web features, and more.
In the Audits tab of the Chrome DevTools, let’s configure the auditing tool. We have the following settings presented before us:
Device
This gives us the option of toggling the user agent between Mobile and Desktop options. More than half of web traffic as of the third quarter of 2018 is generated by Mobile devices, so we will be auditing Scotch.io on Mobile.
Audits
This setting allows us to select what quality of the application we are interested in evaluating and improving. In this case, performance is the main concern, so you can uncheck every other option.
Throttling
This option enables you to simulate the conditions of browsing on a mobile device. You will use the Simulated Fast 3G, 4x CPU Slowdown option. This will actually not throttle during the audit, but it will help calculate how long the page will take to load under mobile conditions.
Clear Storage
This enables you to clear all cached data and resources for the tested page in order to audit how first-time visitors experience the site, so check this option if it isn’t already checked.
After configuring the audit as specified above, click on Generate report and wait while it prepares a detailed report of the site’s performance.
Step 3 — Analyzing the Audit Report
On completion of the audit, the report should look like this:
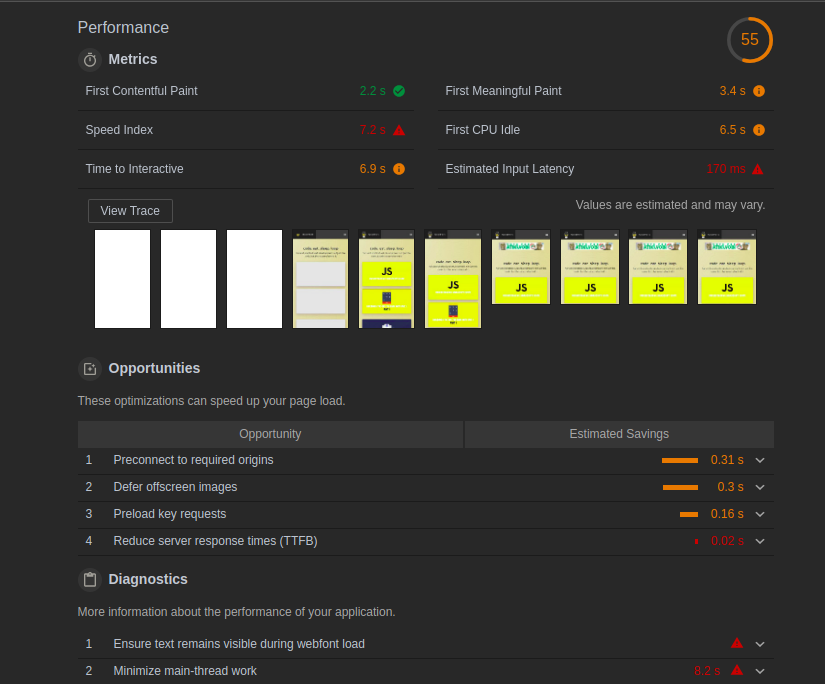
The number in a circle at the top right indicates the overall performance score of the site on a scale of 1–100. We currently have a 55, which indicates that there is a chance for improvement along with the suggestions provided to increase the score and performance. Let’s break the report into sections and analyze them individually.
In the Metrics section, you will find quantitative insight into various aspects of the site’s performance:

Directly below the Metrics section is a group of screenshots that show the various UI states of the page from the point of the initial query until when it loads completely:

The Diagnostics section gives you additional performance information usually indicating the factors that determine a web page’s load time:

Finally, the Passed audits section highlights the performance checks that were passed by the web page:
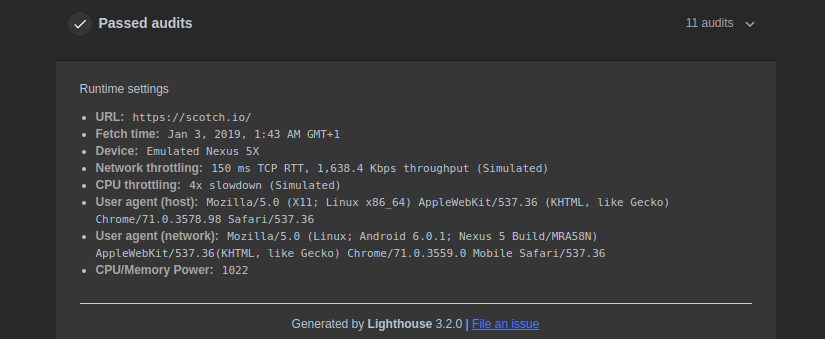
Now that you’ve analyzed the audit, you know what issues may need to be addressed.
Step 4 — Addressing Issues in the Metrics Section
In this example, five performance issues were highlighted. In this step we will explore possible fixes:

First Meaningful Paint
The First Meaningful Paint tells you when the primary content of the page becomes visually available. According to the audit, it takes about 3.4 seconds before you see the main content. This can be confirmed by clicking on the View Trace button. This will take you to the Performance tab where you can go through the various UI states during the load period to confirm what happens at each specific time.
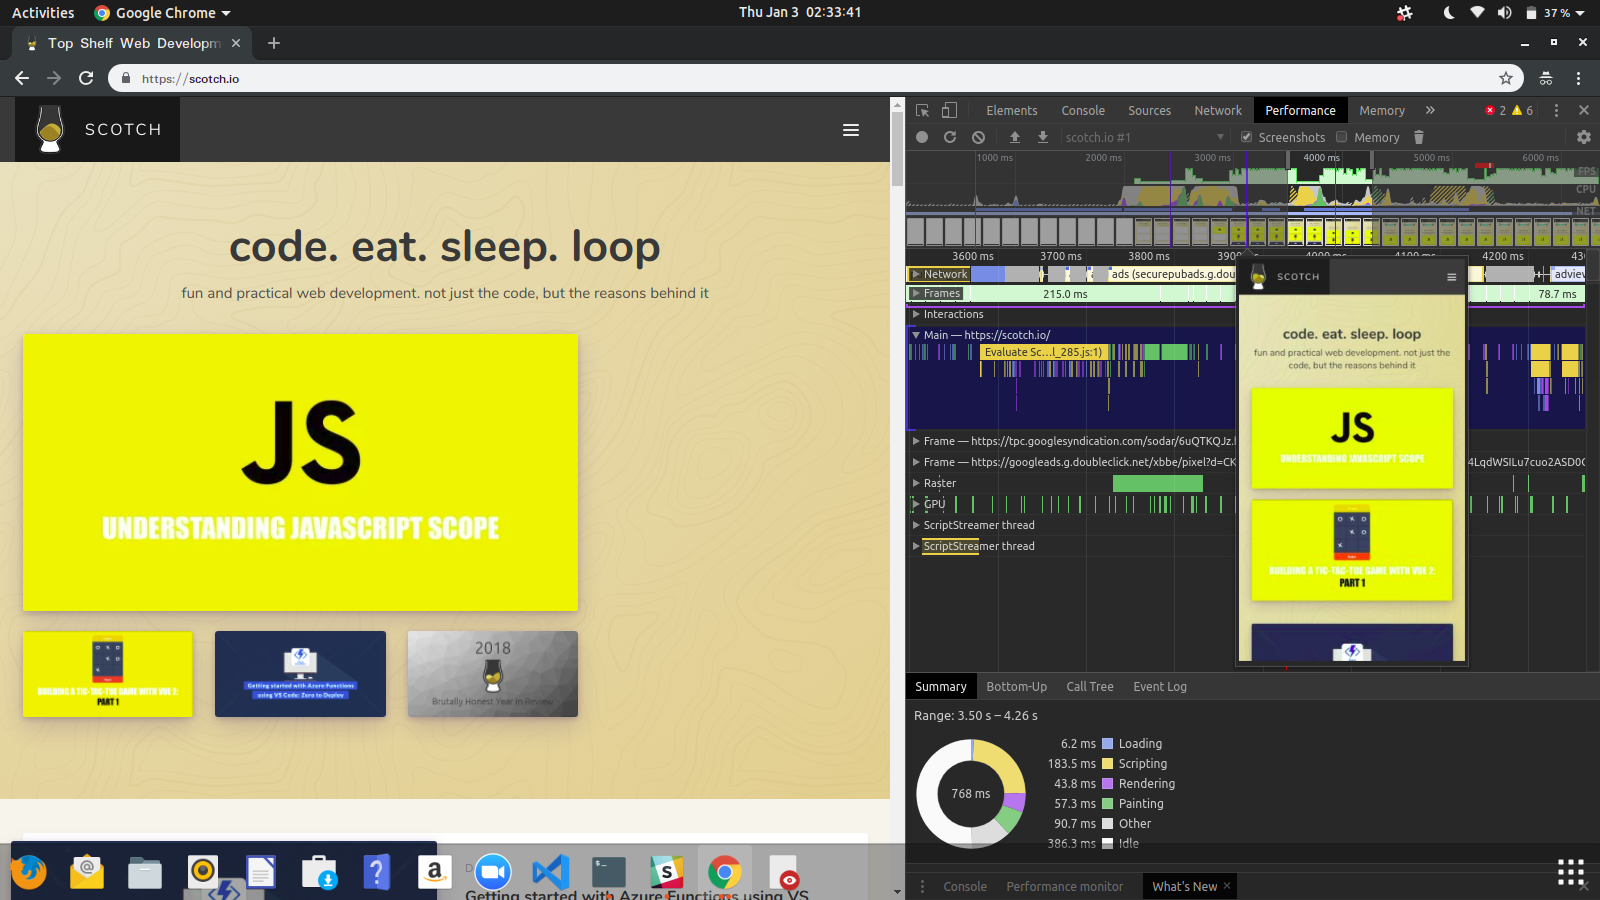
Notice that it is at this time that the page content becomes visible.
In order to improve this, we must optimize the critical rendering path of the page/overall application. This means that we prioritize the display of content as desired by the user in order to create a better experience and improve performance. This can be done by reducing the number of critical resources, the critical path length, and the number of critical bytes.
Speed Index
The Speed Index shows how quickly page content is visibly populated. This takes about 7.2 seconds as shown on the performance tab:
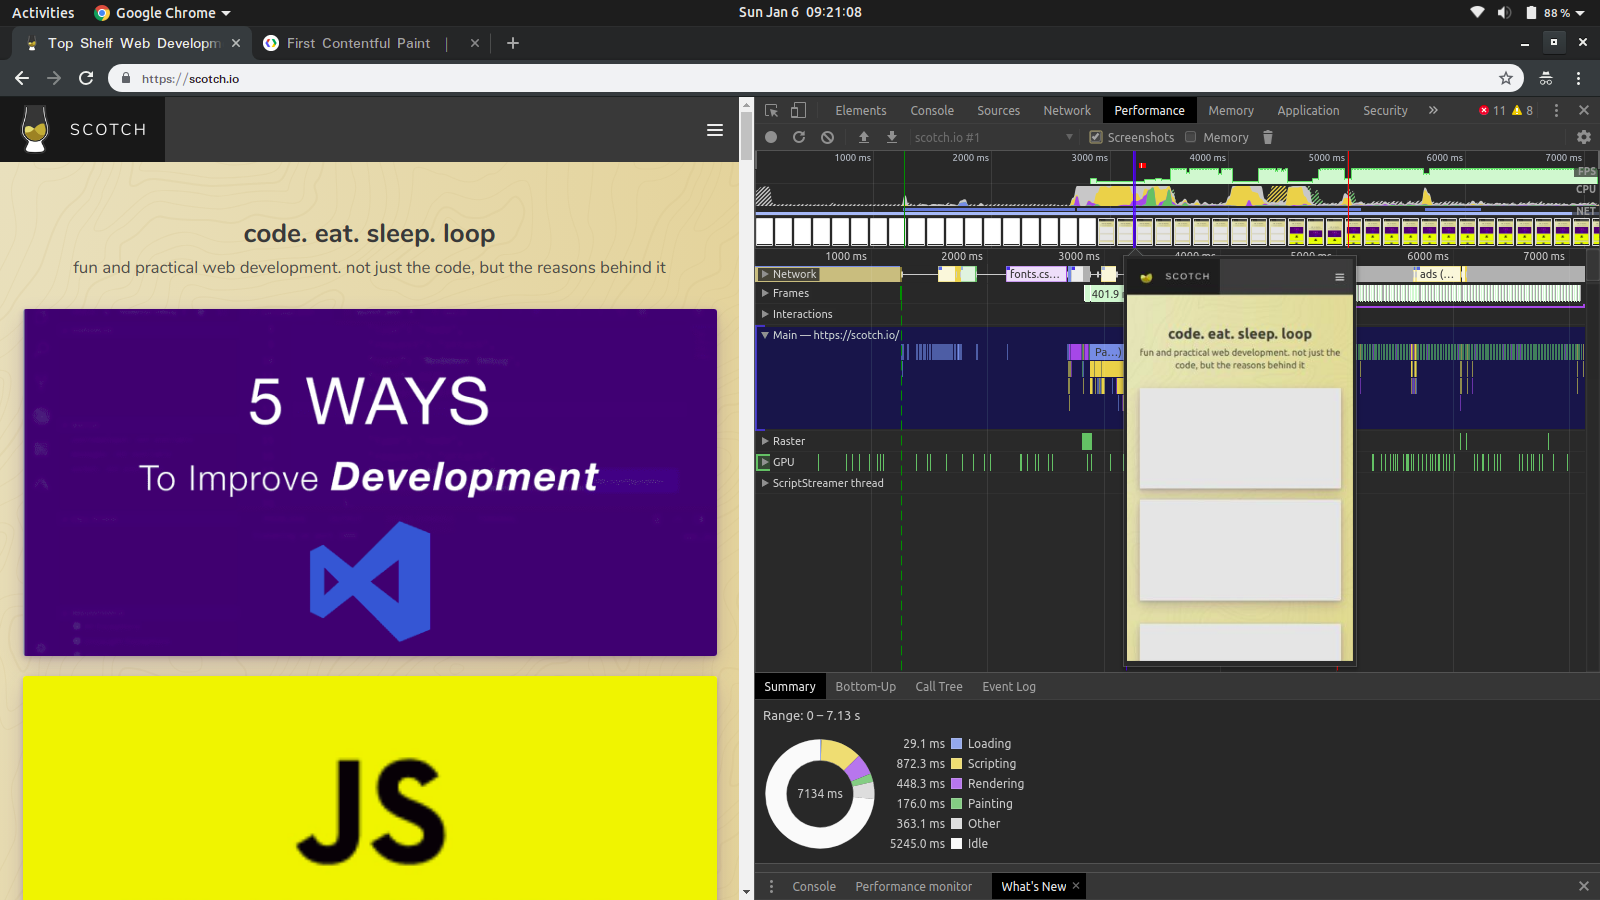
One way to fix this, like in the previously examined metric, is to optimize the critical rendering path. A second way is to optimize content efficiency. This involves manually getting rid of unnecessary downloads, optimizing transfer encoding through compression, and caching whenever possible to prevent re-downloads of unchanging resources.
First CPU Idle
Also known as First Interactive, the First CPU Idle tells you when the page becomes minimally interactive (the CPU is idle enough to handle user input, like clicks, swipe, and so on). From the audit, this takes approximately 6.5 seconds. It is always a win to reduce this value to the minimum:
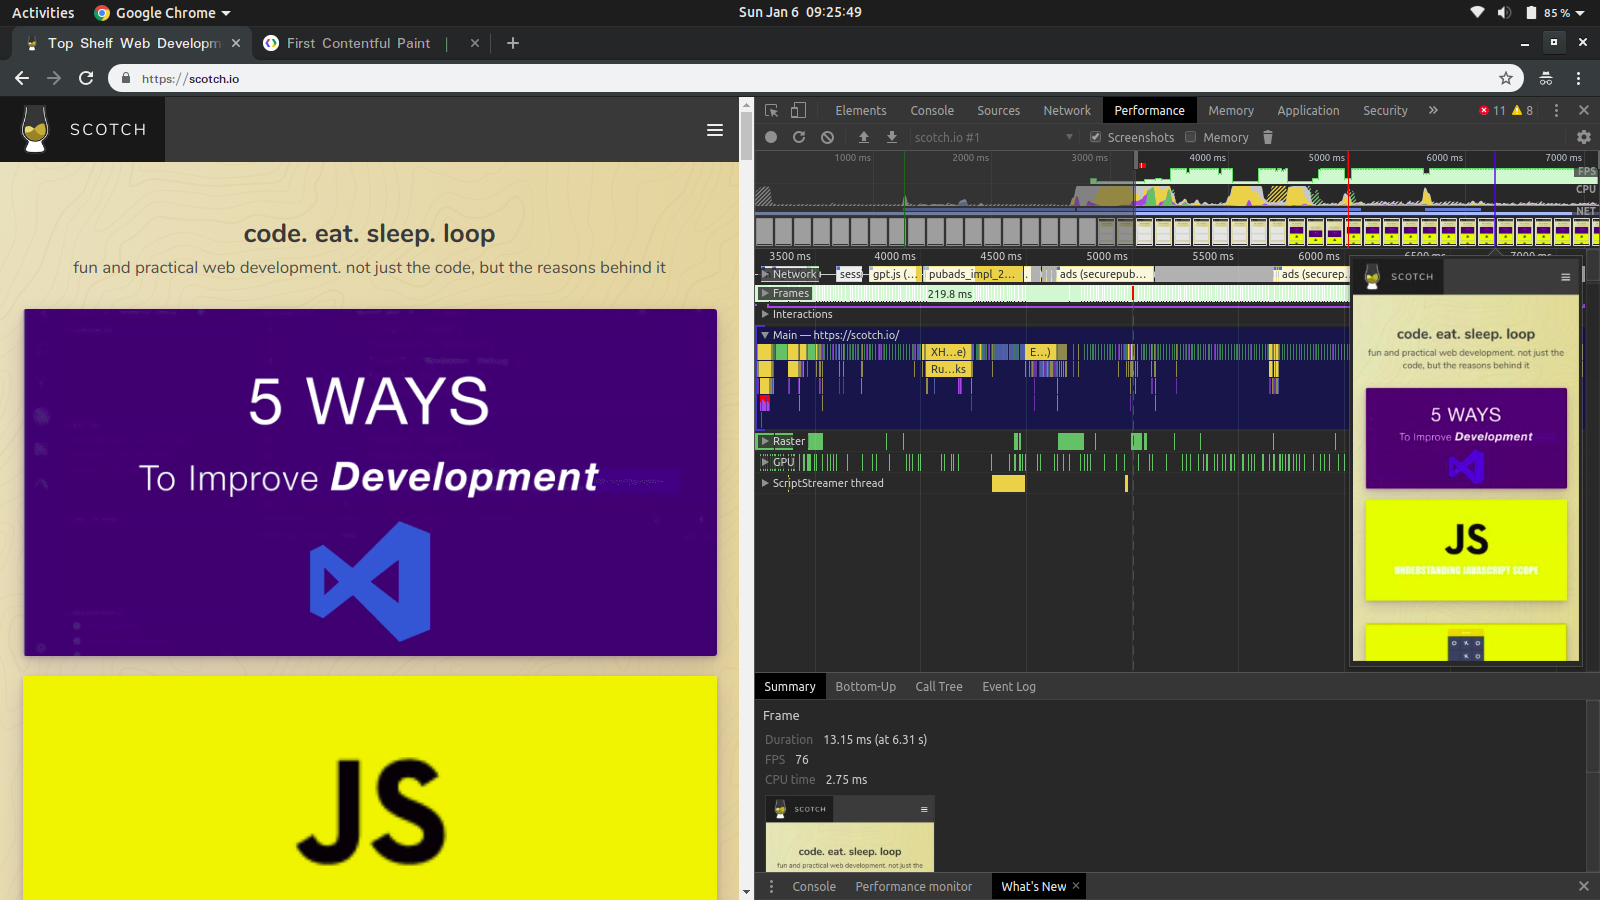
To solve this, you need to take the same steps as with the Speed Index.
Time to Interactive
Time to Interactive shows the time it takes for the page to become fully interactive. The audit in this example reveals 6.9 seconds for this metric. Interactivity in this context describes the point where:
- The page has displayed useful content.
- Event handlers are registered for most visible elements on the page.
- The page responds to user interactions within 50 milliseconds.
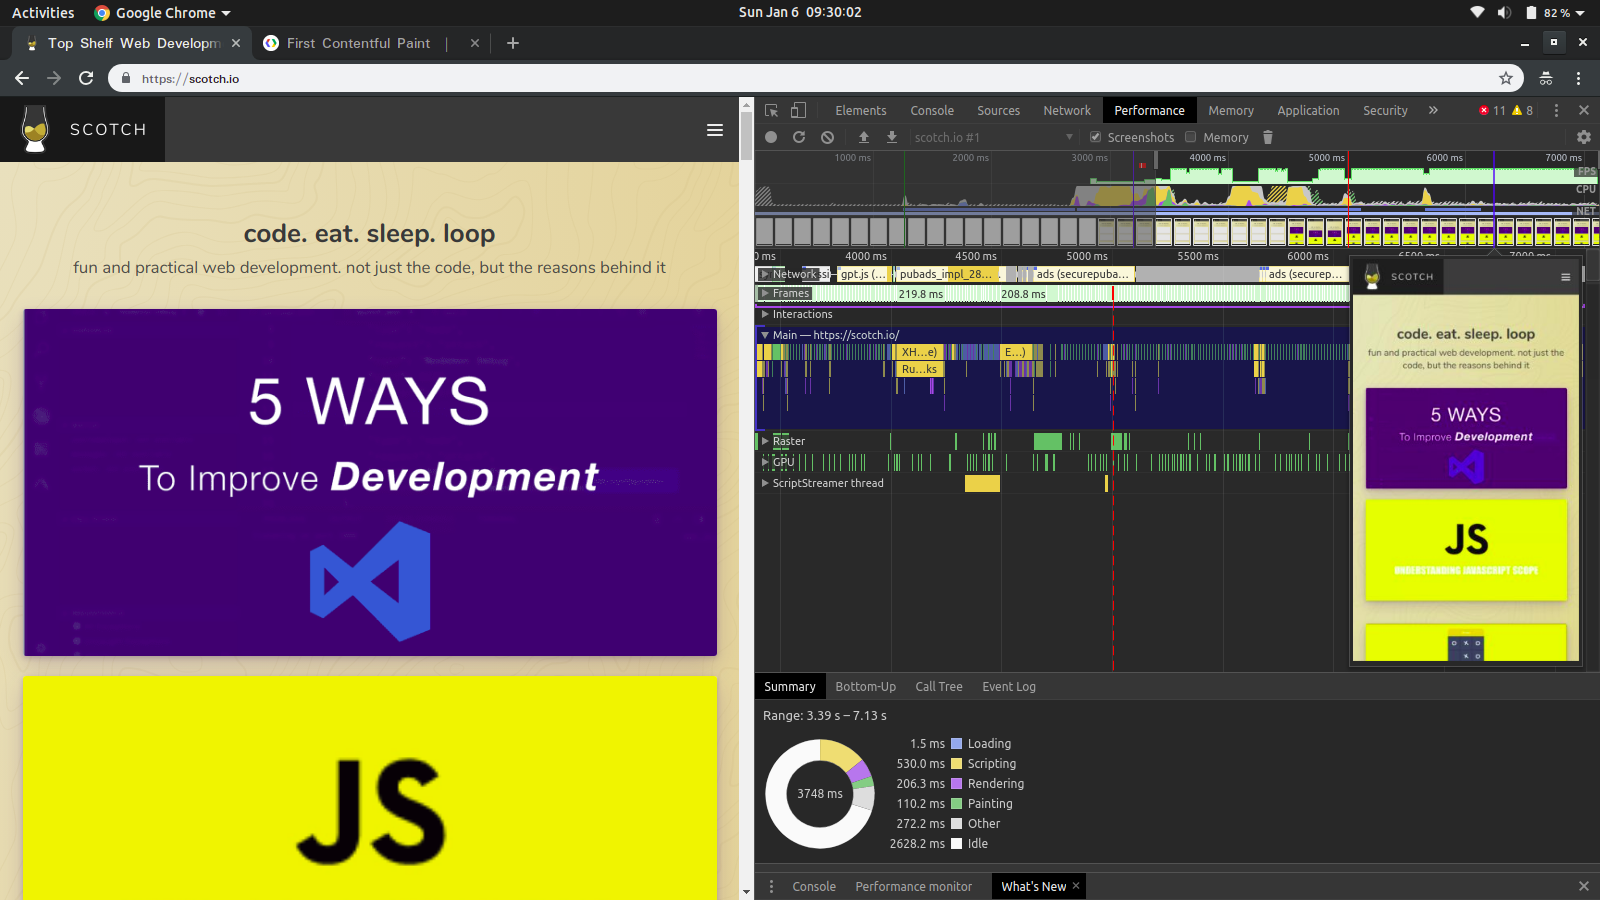
To fix this, you need to defer or remove unnecessary JavaScript work that occurs during page load. This can typically be achieved by sending only the code that a user needs through code splitting and lazy loading, compression, minification, and by removing unused code and caching. You can learn more about optimizing the code here.
Estimated Input Latency
Estimated Input Latency describes the responsiveness of an application to user input. The audit records approximately 170 milliseconds on this metric. Applications generally have 100 milliseconds to respond to a user input, however, the target for Lighthouse is 50 milliseconds. The reason for this disparity is that Lighthouse uses a proxy metric, which is the availability of the main thread to evaluate this metric rather than measuring it directly.
Once it takes longer than the specified time, the app may be perceived as laggy. You can learn more about estimated input latency here.
In order to improve this metric, you could use service workers to perform some computations, thus freeing up the main thread. Another helpful measure is to refactor CSS selectors to ensure they perform fewer calculations.
Step 5 — Addressing Issues in the Opportunities Section
The Opportunities section lists out optimizations that can improve the performance:

Usually, when web pages load, they connect to other origins in order to receive or send data. To improve performance as in this case, it is best to inform the browser to establish a connection to such origins earlier on in the rendering process, thus cutting down on the amount of time spent waiting to resolve DNS lookups, redirects, and several trips back and forth until the client receives a response.
To fix this, you can inform the browser of your intentions to use such resources by adding a rel attribute to link tags as shown below:
<link rel="preconnect" href="https://scotchresources.com">
On secure connections, this could still take some time, so it must be used within 10 seconds or else the browser will automatically close the connection and all the early connection work goes to waste.
Conclusion
We have now successfully received a performance report on Scotch.io using the Audit tool, as well as examined prospective solutions to the identified bottlenecks.
Load is not a single moment in time — it is an experience that no one metric can fully capture. There are multiple moments during the load experience that can affect whether a user perceives it as “fast” or “slow.”
Performance is like a long train, with multiple separate coaches yet similar and united in purpose. In testing, one must pay attention to the little wins that cumulatively increase application speed and result in a better experience for the end user.
For even further reading, the Web Fundamentals section of the Google Developers site is a great resource.
Thanks for learning with the DigitalOcean Community. Check out our offerings for compute, storage, networking, and managed databases.
About the author
Still looking for an answer?
This textbox defaults to using Markdown to format your answer.
You can type !ref in this text area to quickly search our full set of tutorials, documentation & marketplace offerings and insert the link!
- Table of contents
- Prerequisites
- Step 1 — Preparing the Browser
- Step 2 — Performing the Audit
- Step 3 — Analyzing the Audit Report
- Step 4 — Addressing Issues in the Metrics Section
- Step 5 — Addressing Issues in the Opportunities Section
- Conclusion
Deploy on DigitalOcean
Click below to sign up for DigitalOcean's virtual machines, Databases, and AIML products.
Become a contributor for community
Get paid to write technical tutorials and select a tech-focused charity to receive a matching donation.
DigitalOcean Documentation
Full documentation for every DigitalOcean product.
Resources for startups and SMBs
The Wave has everything you need to know about building a business, from raising funding to marketing your product.
Get our newsletter
Stay up to date by signing up for DigitalOcean’s Infrastructure as a Newsletter.
New accounts only. By submitting your email you agree to our Privacy Policy
The developer cloud
Scale up as you grow — whether you're running one virtual machine or ten thousand.
Get started for free
Sign up and get $200 in credit for your first 60 days with DigitalOcean.*
*This promotional offer applies to new accounts only.
