
Introduction
In this tutorial, we will go over the installation of Icinga, an open source monitoring system, on Ubuntu 14.04. We will cover some basic configuration, so you will be able to monitor network services and host resources via the web interface. We will also utilize the Nagios Remote Plugin Executor (NRPE), that will be installed as an agent on remote systems to monitor their local resources (disk usage, number of logged in users, etc.).
Icinga is a popular open source monitoring system that checks hosts and services, and notifies you of their statuses. Icinga is a fork of Nagios, so they are compatible and share many similarities, and it has been gaining popularity due to a more agile development cycle when compared to Nagios.
Prerequisites
To complete this tutorial, you will require root access to an Ubuntu 14.04 VPS. Instructions to set that up can be found here (steps 3 and 4): Initial Server Setup with Ubuntu 14.04.
Also, if you want to set up the mail notification feature, you will need to properly configure Postfix. Instructions to do that can be found here: How To Install and Setup Postfix on Ubuntu 14.04. Postfix is installed along with the Icinga packages, but it can be configured after Icinga is set up.
Install Icinga
We will install Icinga using packages. Also, we will use MySQL as our DBMS–PostgreSQL, SQLite, and Oracle are the other supported options.
Run the following command to add the Icinga PPA to your package manager:
sudo add-apt-repository ppa:formorer/icinga
Then update your apt package database:
sudo apt update
Now install Icinga and MySQL with apt:
sudo apt install icinga icinga-doc icinga-idoutils mysql-server libdbd-mysql mysql-client
Now you will be presented with a series of prompts regarding your Icinga installation. Here is a list of the prompts, and how you should answer them:
- MySQL Configuration: Enter a new MySQL root user password
- PostFix Configuration: Select “Internet Site”
- PostFix Configuration: Enter your Fully Qualified Domain Name (example.com, for example)
- Configuring icinga-cgi: Enter “icingaadmin” user’s password (login to access Icinga).
- Configuring icinga-common: Enter “No” to enabling external commands
- Configuring icinga-idoutils: Enter “Yes” to configuring database for icinga-idoutils with dbconfig-common
- Configuring icinga-idoutils: Select “mysql” as the database type
- Configuring icinga-idoutils: Enter MySQL root password (that you just assigned above)
- Configuring icinga-idoutils: Enter a new icinga-idoutils database user password
Icinga is now installed, but we still need to configure a few things before we can start it. Note that Apache HTTP server and Postfix were installed as part of that process.
Add Apache user (www-data) to nagios group:
sudo usermod -a -G nagios www-data
Enable the ido2db daemon to start on boot up, which stores Icinga events and configurations in the database. Edit Icinga default configuration:
sudo vi /etc/default/icinga
Change the value of IDO2DB to yes, so it looks like the following:
IDO2DB=yes
Save and quit. Now start the ido2db service:
sudo service ido2db start
Enable idomod module by copying the sample idoutils.cfg file to Icinga’s active configuration:
sudo cp /usr/share/doc/icinga-idoutils/examples/idoutils.cfg-sample /etc/icinga/modules/idoutils.cfg
Now Icinga is configured and ready to be started:
sudo service icinga restart
Let’s try out the Icinga user interface.
Accessing the Icinga User Interface
Go to http://yourhost/icinga, and log in using the icingaadmin login that you set up during the Icinga installation.
You should see that Icinga is monitoring one host, localhost (your Icinga server), and seven services, like this:

The top row shows that the single monitored host is “Up”, and the bottom row shows that there are seven “OK” monitored services.
If the status of localhost is “Down”, you might need to change the permissions of your ping command. Run the following command to allow the nagios user to use the ping command:
sudo chmod u+s `which ping`
Let’s add more hosts and services to be monitored!
Ways To Monitor With Icinga
There are two main ways to monitor hosts and services with Icinga:
- Monitoring “publicly available services”
- Monitoring via an agent that is installed on a remote host to gather and send data to Icinga
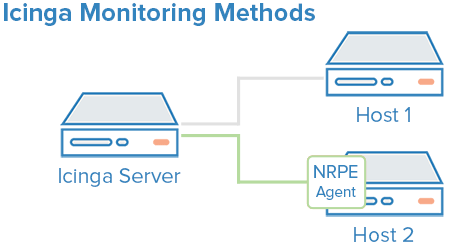
With the first method, publicly available services refers to services that are accessible across the local network or the Internet. Common examples include HTTP, mail, SSH, and ICMP ping. This method is useful for monitoring systems that you can’t (or don’t want to) install an agent on, and also for monitoring user facing network interfaces.
To implement the second method, we will install NRPE as an agent on remote hosts to monitor their local resources. This will allow Icinga to monitor things like disk usage, running processes, and other system stats that the first method can’t achieve.
Method 1: Monitoring Publicly Available Services
Because the first method simply monitors listening services, the configuration for this method is done all on the Icinga server. Several things can be monitored with this method, so we will demonstrate how to monitor a public interface of a web server.
Create a file with the name of your host, with this command (substitute yourhost with your own hostname):
sudo vi /etc/icinga/objects/yourhost.cfg
Now add the following, replacing the values of host_name with your own hostname (in both places), alias with a description of the host, and address with the value of your host’s public IP address:
define host {
        use                     generic-host
        host_name               web-1
        alias                   A Web Server
        address                 107.170.xxx.xxx
}

define service {
        use                     generic-service
        host_name               web-1
        service_description     HTTP
        check_command           check_http
}
Now save and quit. Reload your Icinga configuration to put any changes into effect:
sudo service icinga reload
Method 2: Monitoring Via an Agent
As mentioned earlier, we will be using NRPE as our agent to gather remote host data for Icinga. This means that NRPE must be installed on all hosts that will be monitored with this method, and the Icinga server also needs to be configured to receive data for each host.
Let’s go over installing NRPE.
Installing NRPE On a Remote Host
On a host that you want to monitor, update apt:
sudo apt update
Now install NRPE and Nagios Plugins:
sudo apt install nagios-plugins nagios-nrpe-server
Look up the name of your root filesystem (because it is one of the items we want to monitor):
df -h /
We will be using the filesystem name in the NRPE configuration to monitor your disk usage (it is probably /dev/vda). Now open nrpe.cfg for editing:
sudo vi /etc/nagios/nrpe.cfg
The NRPE configuration file is very long and full of comments. There are a few lines that you will need to find and modify:
- server_address: Set to the private IP address of this host
- allowed_hosts: Set to the private IP address of your Icinga server
- command[check_hda1]: Change
/dev/hda1to whatever your root filesystem is called
The three aforementioned lines should look like this (substitute the appropriate values):
server_address=client_private_IP
allowed_hosts=nagios_server_private_IP
command[check_hda1]=/usr/lib/nagios/plugins/check_disk -w 20% -c 10% -p /dev/vda
Note that there are several other “commands” defined in this file that will run if the Icinga server is configured to use them. Also note that NRPE will be listening on port 5666 because server_port=5666 is set. If you have any firewalls blocking that port, be sure to open it to your Icinga server.
Save and quit. Then restart NRPE to put the changes into effect:
sudo service nagios-nrpe-server restart
Once you are done installing and configuring NRPE on the hosts that you want to monitor, you will have to add these hosts to your Icinga server configuration before it will start monitoring them.
Add Remote Host To Icinga Server Configuration
On your Icinga server, create a new configuration file for each of the remote hosts that you want to monitor in /etc/icinga/objects. Replace yourhost with the name of your host:
sudo vi /etc/icinga/objects/yourhost.cfg
Add in the following host definition, replacing the host_name value with your remote hostname (I used “wordpress-1” in my example), the alias value with a description of the host, and the address value with the private IP address of the remote host:
define host {
        use                     generic-host
        host_name               wordpress-1
        alias                   My first wordpress server
        address                 10.128.xxx.xxx
        }
Then add any of these service blocks for services you want to monitor. Note that the value of check_command determines what will be monitored, including status threshold values. Here are some examples that you can add to your host’s configuration file:
Ping:
define service {
        use                             generic-service
        host_name                       wordpress-1
        service_description             PING
        check_command                   check_ping!100.0,20%!500.0,60%
        }
SSH (notifications_enabled set to 0 disables notifications for a service):
define service {
        use                             generic-service
        host_name                       wordpress-1
        service_description             SSH
        check_command                   check_ssh
        notifications_enabled           0
        }
Load:
define service {
        use                             generic-service
        host_name                       wordpress-1
        service_description             Current Load
        check_command                   check_load!5.0!4.0!3.0!10.0!6.0!4.0
        }
Current Users:
define service {
        use                             generic-service
        host_name                       wordpress-1
        service_description             Current Users
        check_command                   check_users!20!50
        }
Disk Space:
define service {
        use                             generic-service
        host_name                       wordpress-1
        service_description             Disk Space
        check_command                   check_all_disks!20%!10%
        }
If you’re wondering what use generic-service means, it is simply inheriting the values of a service template called “generic-service” that is defined by default.
Now save and quit. Reload your Icinga configuration to put any changes into effect:
sudo service icinga reload
Once you are done configuring Icinga to monitor all of your remote hosts, let’s check out the user interface.
User Interface Example
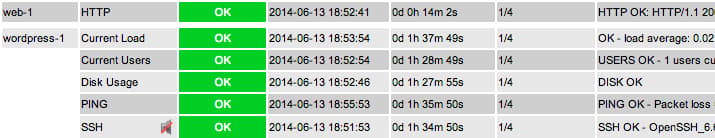
After setting up a monitoring on a few hosts with either monitoring method, go to your Icinga user interface (http://youricingaserver.com/icinga, acingaadmin login), then click on the Service Detail link. You should see a list of all of the services that you set up monitoring for.
As an example, here are two hosts that are being monitored using the configuration files that were described above. web-1 HTTP service is being monitored via its normal HTTP port, indicating that its web server is responding with an OK status, and wordpress-1 is showing that all its monitored services are OK.
Icinga has a plethora of features, so feel free to browse the interface to see what you can discover about your hosts and services.
Conclusion
Now that you monitoring your hosts and some of their services, you might want to spend some time to figure out which services are critical to you, so you can start monitoring those. You may also want to set up notifications so, for example, you receive an email when your disk utilization reaches a warning or critical threshold or your main website is down, so you can resolve the situation promptly or before a problem even occurs.
Good luck!
Thanks for learning with the DigitalOcean Community. Check out our offerings for compute, storage, networking, and managed databases.
About the author
Software Engineer @ DigitalOcean. Former Señor Technical Writer (I no longer update articles or respond to comments). Expertise in areas including Ubuntu, PostgreSQL, MySQL, and more.
Still looking for an answer?
This textbox defaults to using Markdown to format your answer.
You can type !ref in this text area to quickly search our full set of tutorials, documentation & marketplace offerings and insert the link!
Thanks for your guides Mitchell I’ve found this one and the Logstash one very useful.
I did run into an issue with the icinga web feature though. I had to install icinga-web (classic) to get the web-ui up. It doesn’t appear to be installed as part of your set-up guide. Did I miss a step?
Hi Mitchell, first thanks for your tutorial which is a great quickstart for monitoring. I’m just having an issue concerning ido2db, when I try to start the service, I have the following message: Support for the specified database server is either not yet supported, or was not found on your system. 1 drivers available: mysql
I checked the ido-mysql.conf file and ensured that the user defined inside exists in my mysql server. And it sounds funny that mysql is not supported. As I installed everything with apt and followed quite the same steps as you did, I’m wondering what is missing.
@eg.galano: It should install with the rest of the packages. Not sure what the issue is. Sorry.
@onizukapower: Double-check that all the correct packages were installed, and that your responses to the prompts match the responses listed in the tutorial.
Mitchel, what should we do if we already have a Apache in server? I just got 403 error and I don’t know how configure icinga and apache. Could you help me?
I’m using apache proxy reverse and try to configure /icinga mapping to myhost/icinga, but I got 403 error. When I changed my proxy string to /icinga-web, I got 404 error, but icinga log is like icinga is up.
@manicas I’ve looked all icinga references with “find / -name icinga” and give permission with “chgrp -R www-data directory”. I executed your last recomendation but I still got 403 forbidden error when I try access Icinga. I already have a Apache server installed before install Icinga. I’m using Ubuntu server and I don’t know any more what can I do to use Icinga.
I give permission to /usr/share/icinga too, but it didn’t work.
Running this “tail -300f /var/log/icinga/icinga.log” I found it “[1411522966] idomod: Still unable to connect to data sink. 988240 items lost, 5000 queued items to flush. Is ido2db running and processing data”. Any clue what could be it?
I managed to install Icinga following this tutorial on my Ubuntu 14.04 server. Great work. But, when i tried to install Icinga on a Centos 7 server, it resulted in many errors and the installation didn’t finished. Luckily for me, i found this good article on installing Icinga on Centos 7 and it worked.
Hi,
I’m seeing the localhost down but i’m not sure how to use this command sudo chmod u+s `which ping` , specifically the ‘which ping’ part.
Hi Mitchell,
I followed your instruccions carefully and everything seemed to work smoothly however I found out a problem regarding some config setting, object definition types and variables being deprecated.
From my syslog:
Jan 21 13:32:02 icinga icinga: Warning: config setting 'event_profiling_enabled' unknown. Remove it from your configuration!
Jan 21 13:32:02 icinga icinga: Warning: Object definition type 'hostextinfo' is DEPRECATED in file '/etc/icinga/objects/extinfo_icinga.cfg' on line 5.
Jan 21 13:32:02 icinga icinga: Warning: Variable 'normal_check_interval' with value '10' is DEPRECATED. Replace it with 'check_interval'.
Jan 21 13:32:02 icinga icinga: Warning: Variable 'retry_check_interval' with value '2' is DEPRECATED. Replace it with 'retry_interval'.
Jan 21 13:32:02 icinga icinga: Warning: Variable 'normal_check_interval' with value '5' is DEPRECATED. Replace it with 'check_interval'.
Jan 21 13:32:02 icinga icinga: Warning: Variable 'retry_check_interval' with value '1' is DEPRECATED. Replace it with 'retry_interval'.
Warning # 1 was corrected by commenting out the config setting “event profiling enabled” at the bottom of the file /etc/icinga/icinga.cfg (I had to comment “event profiling enabled” out though it was set to 0, which meant that it was already disabled)
Warning # 2 was corrected by commenting out the whole content of file /etc/icinga/objects/extinfo_icinga.cfg
Warnings # 3 & 4 were corrected by doing the proposed replacements in file /etc/icinga/objects/ido2db_check_proc.cfg
Warnings # 5 & 6 were corrected by doing the proposed replacements in file /etc/icinga/objects/generic-service_icinga.cfg
In addition, when parsing out my syslog I observed these errors also:
Jan 21 13:49:19 icinga icinga: LOG VERSION: 2.0
Jan 21 13:49:19 icinga icinga: idomod: IDOMOD 1.11.6 (08-06-2014) Copyright(c) 2005-2008 Ethan Galstad, Copyright(c) 2009-2014 Icinga Development Team (https://www.icin
ga.org)
Jan 21 13:49:19 icinga icinga: idomod: Could not open data sink!  I'll keep trying, but some output may get lost. Is ido2db running and processing data?
Jan 21 13:49:19 icinga icinga: Event broker module 'IDOMOD' version '1.11.6' from '/usr/lib/icinga/idomod.so' initialized successfully.
Jan 21 13:49:19 icinga icinga: Finished daemonizing... (New PID=1289)
Jan 21 13:49:19 icinga icinga: Event loop started...
Jan 21 13:49:20 icinga postfix/master[1416]: daemon started -- version 2.11.0, configuration /etc/postfix
Jan 21 13:49:20 icinga ido2db: IDO2DB 1.11.6 (08-06-2014) Copyright(c) 2005-2008 Ethan Galstad, Copyright(c) 2009-2014 Icinga Development Team (https://www.icinga.org)
Jan 21 13:49:20 icinga ido2db: IDO2DB 1.11.6 starting... (PID=1450)
Jan 21 13:49:20 icinga ido2db: Error: Could not connect to mysql database: 2002: Can't connect to local MySQL server through socket '/var/run/mysqld/mysqld.sock' (2)
Jan 21 13:49:20 icinga ido2db: Error: Database connection for schema check failed, bailing out...
Jan 21 13:49:20 icinga ido2db: Program shutdown... (PID=1450)
.
Jan 21 13:49:37 icinga icinga: idomod: Still unable to connect to data sink.  0 items lost, 3943 queued items to flush. Is ido2db running and processing data?
Jan 21 13:49:55 icinga icinga: idomod: Still unable to connect to data sink.  0 items lost, 3955 queued items to flush. Is ido2db running and processing data?
Jan 21 13:50:13 icinga icinga: idomod: Still unable to connect to data sink.  0 items lost, 3967 queued items to flush. Is ido2db running and processing data?
There was a problem with the ido2db service. It did not start after a reboot although I set “IDO2DB=yes” in the /etc/default/icinga file.
I could not figure out what was going out exactly, so I edit the /etc/rc.local file and put this line within:
“/etc/init.d/ido2db start”
Now, everything goes ok, however the “rc.local” trick is not the right way to go.
Would you be so kind to tell me what do you think is going on??
Thanks!
dear DigitalOcean community, can i follow this tutorial if i am running Nginx on Ubuntu 14.04.2? Thank you!
 This work is licensed under a Creative Commons Attribution-NonCommercial- ShareAlike 4.0 International License.
Become a contributor for community
Get paid to write technical tutorials and select a tech-focused charity to receive a matching donation.

DigitalOcean Documentation
Full documentation for every DigitalOcean product.

Resources for startups and AI-native businesses
The Wave has everything you need to know about building a business, from raising funding to marketing your product.
The developer cloud
Scale up as you grow — whether you're running one virtual machine or ten thousand.

Start building today
From GPU-powered inference and Kubernetes to managed databases and storage, get everything you need to build, scale, and deploy intelligent applications.
