By Mateusz Papiernik and Sharon Campbell
Not using Ubuntu 14.04?
Choose a different version or distribution.
Introduction
If you’re a system administrator, you should know the current state of your infrastructure and services. There is nothing worse than noticing too late that your disks are failing, or being notified of service downtime by your users instead of noticing before them.
That’s where monitoring comes into play. Software that keeps track of your servers’ hardware, uptime, and service statuses, and that raises alerts when something goes wrong, can save lots of headaches. In a very basic scenario a monitoring system would alert you if any services go down. In a more robust one, the notifications would come shortly after any suspicious signs arose, such as increased memory usage or an abnormal amount of TCP connections.
There are many monitoring solutions available with varying degrees of complexity and varying feature sets, both free and commercial. In many cases the installation, configuration, and management of these tools is difficult and time-consuming. Today we’ll focus on a solution that is simple to set up.
Open Monitoring Distribution (OMD) is a self-contained bundle that includes Nagios together with add-ons for gathering, monitoring, and graphing data. It comes bundled with Check_MK Multisite, a comprehensive tool that addresses many of Nagios’s shortcomings. It provides a web interface for easy administration and configuration, a user-friendly dashboard, a robust notification system, and easy-to-install monitoring agents for many Linux distributions. If it weren’t for Check_MK Multisite we would have to use different views for different tasks and it wouldn’t be possible to configure all the settings without resorting to working with configuration files.
Open Monitoring Distribution with Check_MK makes it easy and accessible for everyone to set up their own monitoring system. In this text we will show how to install and configure necessary tools to monitor two Droplets. Here are your prerequisites:
- One Droplet with Ubuntu 14.04
- One Droplet with CentOS 7
- root access to your Droplets
Throughout the article we will assume that you have basic understanding of the command line, but there are no further prerequisites for following this tutorial.
Setting Up the OMD Instance on an Ubuntu Droplet
To get started with the OMD installation we will need a working Ubuntu 14.04 Droplet with root privileges. All instructions below have been written using a clean Ubuntu 14.04 Droplet with no additional software. You can also add monitoring to a Droplet with, for example, a web server already running.
It is a good practice to update the system packages to their latest version before installing new software. To do so, run:
apt-get update
apt-get upgrade
The OMD project provides ready-to-use packages for Ubuntu on the project website.
To browse the packages we can go to the package listing site. For Ubuntu 14.04 x64, the latest version at the time of writing this text, the correct package is omd-1.20.trusty.amd64.deb.
To download the package, execute:
wget http://files.omdistro.org/releases/debian_ubuntu/omd-1.20.trusty.amd64.deb
Since the file is quite big, it may take some time to download. When the download completes you should see a message similar to the one below:
100%[=================================================================>] 78,969,558  24.6MB/s   in 3.1s

2014-08-30 06:23:21 (24.6 MB/s) - "omd-1.20.trusty.amd64.deb" saved [78969558/78969558]
To install the newly downloaded package, type:
dpkg -i omd-1.20.trusty.amd64.deb
This will fail on the first try, since the OMD package has multiple dependencies. That’s fine. After trying to install the package, we will see an error message:
root@omdmaster:~# dpkg -i omd-1.20.trusty.amd64.deb
Selecting previously unselected package omd-1.20.
(Reading database ... 86590 files and directories currently installed.)
Preparing to unpack omd-1.20.trusty.amd64.deb ...
Unpacking omd-1.20 (0.trusty) ...
dpkg: dependency problems prevent configuration of omd-1.20:
 omd-1.20 depends on libsnmp-python; however:
  Package libsnmp-python is not installed.
 omd-1.20 depends on dialog; however:
  Package dialog is not installed.
 omd-1.20 depends on fping; however:
  Package fping is not installed.
 omd-1.20 depends on graphviz; however:
  Package graphviz is not installed.
 omd-1.20 depends on libapache2-mod-fcgid; however:
  Package libapache2-mod-fcgid is not installed.
 omd-1.20 depends on libapache2-mod-proxy-html; however:
  Package libapache2-mod-proxy-html is not installed.
 omd-1.20 depends on apache2-mpm-prefork; however:
  Package apache2-mpm-prefork is not installed.
 omd-1.20 depends on apache2-utils; however:
  Package apache2-utils is not installed.
 omd-1.20 depends on libboost-program-options1.54.0; however:
  Package libboost-program-options1.54.0 is not installed.
 omd-1.20 depends on libboost-system1.54.0; however:
  Package libboost-system1.54.0 is not installed.
 omd-1.20 depends on libdbi1; howeve
dpkg: error processing package omd-1.20 (--install):
 dependency problems - leaving unconfigured
Processing triggers for ureadahead (0.100.0-16) ...
Processing triggers for man-db (2.6.7.1-1) ...
Errors were encountered while processing:
 omd-1.20
That failed installation automatically notified the package manager of missing dependencies, which allows us to easily resolve the problem without resorting to manual installation.
To resolve missing dependencies, we must execute:
apt-get -f install
We will see that apt-get wants to install many new packages, including apache2 and mysql. This is expected, since OMD is using a web-accessible user interface and stores some of its data in a MySQL database.
Run this command:
apt-get -f install
Now the installation should complete successfully:
Reading package lists... Done
Building dependency tree
Reading state information... Done
Correcting dependencies... Done
The following extra packages will be installed:
  apache2 apache2-bin apache2-data (...)
0 upgraded, 147 newly installed, 0 to remove and 3 not upgraded.
1 not fully installed or removed.
Need to get 53.9 MB of archives.
After this operation, 275 MB of additional disk space will be used.
Do you want to continue? [Y/n]
After agreeing to the installation of all dependencies (press y), we will be prompted to set up a root password for the MySQL database.
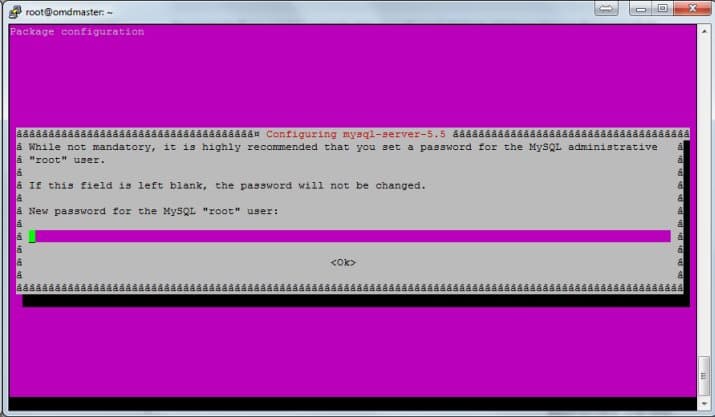
For security reasons it is a good idea to use a strong password not used anywhere else. This password will not be needed during OMD setup, but it will be possible to access all databases, including OMD databases, with this password.
After entering the password, the installation will continue with no more prompts. The OMD package we tried to install beforehand will also be automatically installed during the process. After the installation completes, it should be possible to access the omd command like this:
omd
Output:
Usage (called as root):

 omd help                        Show general help
 (...)

General Options:
 -V <version>                    set specific version, useful in combination with update/create
 omd COMMAND -h, --help          show available options of COMMAND
The omd command is the main command used to manage OMD instances on the server. It is used to start and stop all the monitoring services at once, and we will use it to create the first OMD instance.
Now we have to create the first OMD instance. In most cases, the first instance is the only one on the server, and that is how we will do it here.
Before we create the OMD instance we will have to choose the name by which the instance will be identified. It is used further on during configuration, but also defines the web address at which the monitoring site will be accessible. For the sake of simplicity we will use monitoring throughout the text. To create the instance, type:
omd create monitoring
The omd tool will set up everything for us automatically. The command output should look similar to the one below:
Adding /omd/sites/monitoring/tmp to /etc/fstab.
Restarting Apache...AH00558: apache2: Could not reliably determine the server's fully qualified domain name, using 127.0.1.1. Set the 'ServerName' directive globally to suppress this message
OK
Creating temporary filesystem /omd/sites/monitoring/tmp...OK
Created new site monitoring with version 1.20.

  The site can be started with omd start monitoring.
  The default web UI is available at http://omdmaster/monitoring/
  The admin user for the web applications is omdadmin with password omd.
  Please do a su - monitoring for administration of this site.
The instance is now created, but still needs to be started. To start the instance, type:
omd start monitoring
All necessary tools and services will be started at once. At the end we should see that all services have been started successfully as follows:
Starting rrdcached...OK
Starting npcd...OK
Starting nagios...OK
Starting dedicated Apache for site monitoring...OK
Initializing Crontab...OK
Now that the instance is up and running we can access it via the a web browser.
To access the OMD instance, please open http://your_droplet_ip/monitoring/ in the web browser. We will be prompted for a password. The default one is omdadmin for username and omd for password, and we will change these defaults later on.
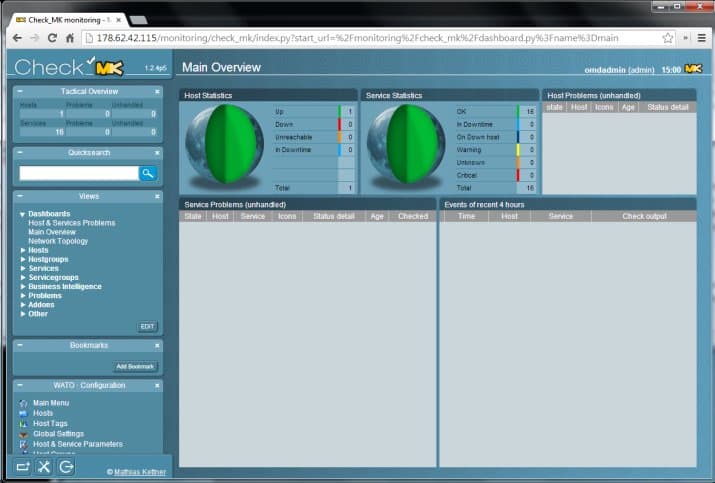
Upon logging in we should see a web page like the one below:
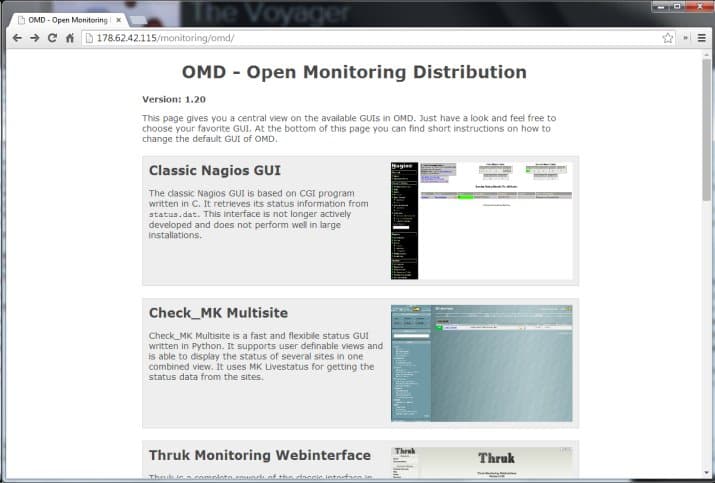
This is the default OMD web page, giving access to all installed tools and applications. The only one we will use, however, is the Check_MK Multisite tool. It’s a wonderful tool, not only giving us a user-friendly way of configuring almost every aspect of OMD and its tools, but also gathering graphs, alerts, and settings into one dashboard. We will refer to Check_MK Multisite as simply Check_MK from now on.
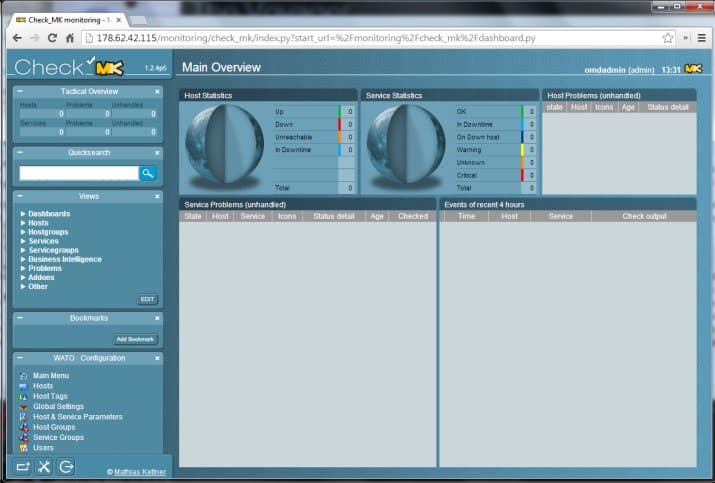
The Check_MK screen opens with a dashboard by default, which shows all services and server statuses in lists and uses practical graphs resembling the Earth. Straight after installation it is empty, but we will make it display statuses for our services and systems shortly.
Changing Administrative Password
The default omdadmin/omd username and password is easy to remember, but not secure at all, especially since it is provided with every OMD installation by default. It is fortunately very easy to change.
First, open the Users pane from the WATO Configuration menu on the left. The list will show all users that currently have access to the OMD site, by default listing only omdadmin.
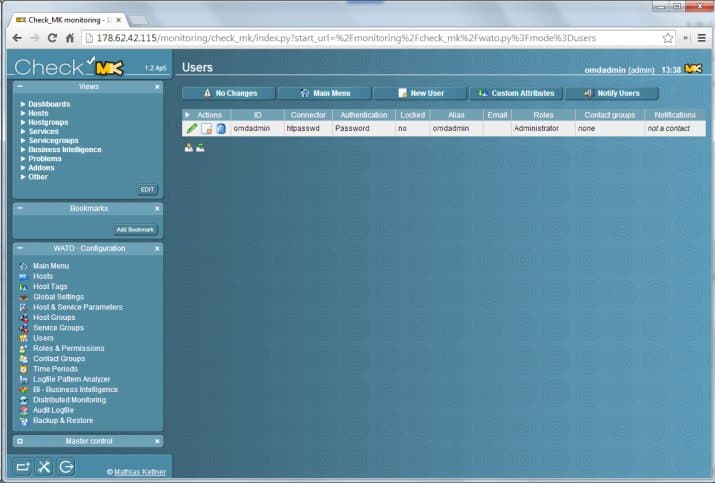
Click on the pencil icon next to the omdadmin user to change its details, including the password.
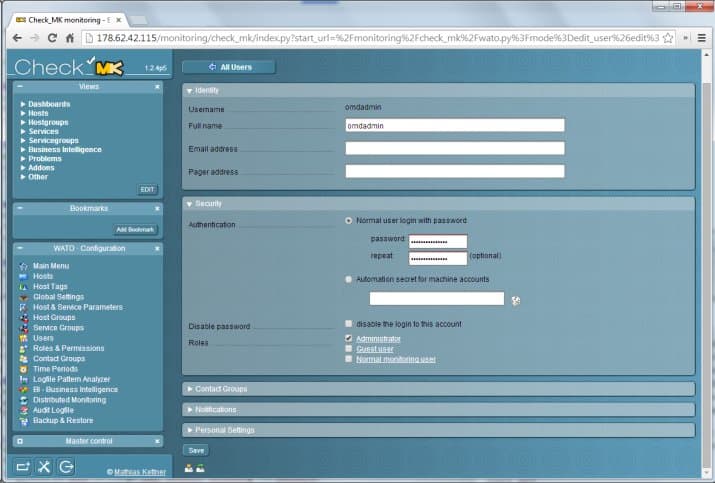
Update the password, add an admin email, and make any other desired changes.
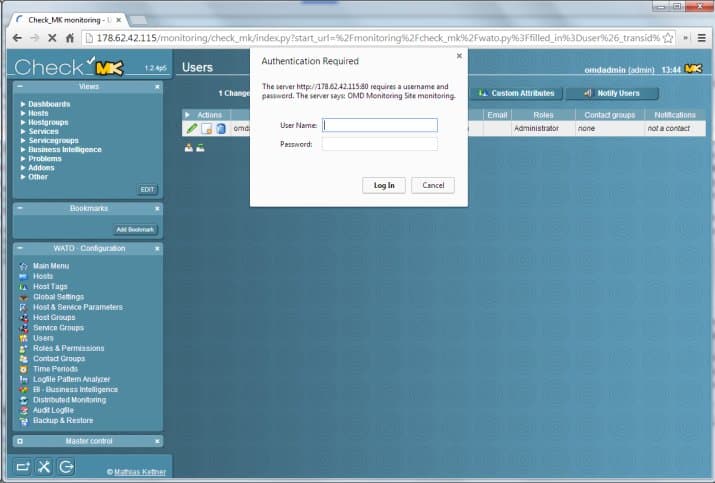
Immediately after saving the changes we will be asked to log in again using our new credentials. Use your new password here.
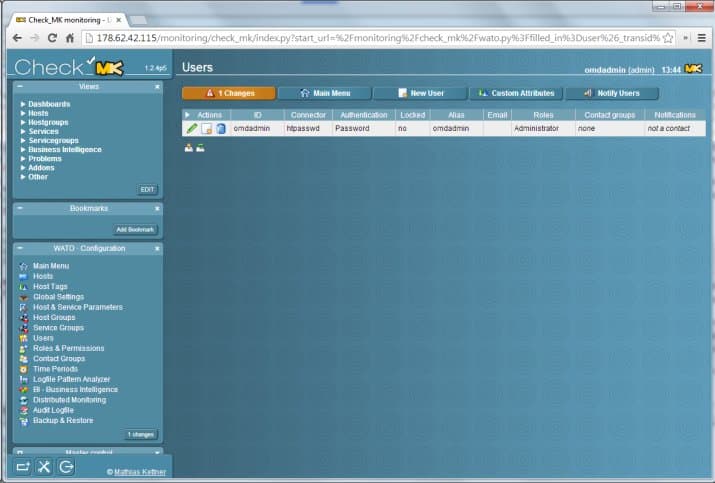
Now we need to save the changes to the configuration files. This is denoted by the orange button 1 Changes that tells us that we have made some changes to the configuration of Check_MK that need to be saved and activated. This will happen every time we change the configuration of our monitoring system, not only after editing a user’s credentials. To save and activate pending changes we have to click on this button and agree to activate the listed changes.
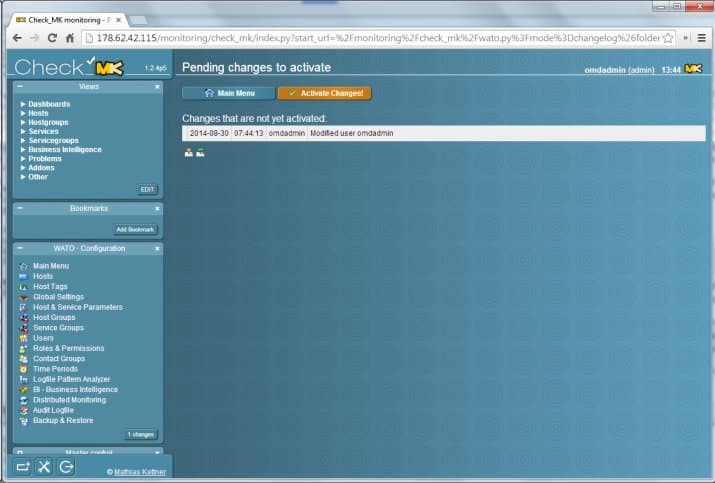
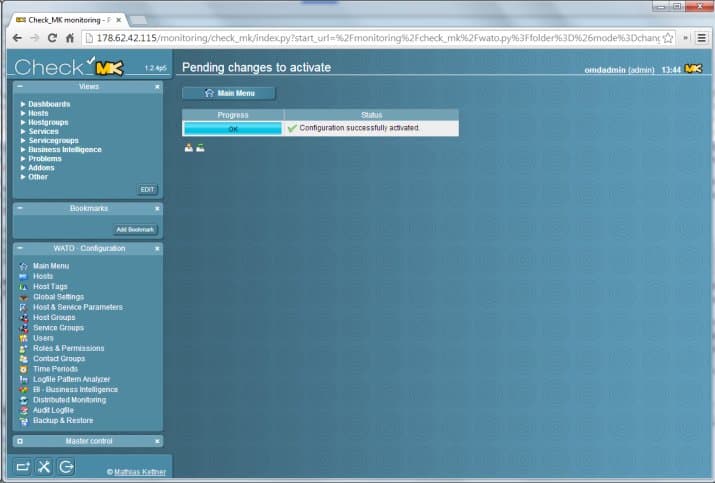
After activating the changes the new user’s data is written to the configuration files and will be used by all the system’s components. Check_MK automatically takes care of notifying individual monitoring system components, reloading them when necessary, and managing all the needed configuration files.
Monitoring the First Host
The components installed with OMD are responsible for gathering, storing, and presenting monitoring information. They do not provide the information itself.
To gather the actual data, we will use Check_MK Agent, a tool designed specifically for Check_MK, capable of monitoring all vital system components at once.
Installing the Agent
The first host we monitor will be the OMD Droplet itself.
To begin monitoring we have to install the Check_MK Agent first. Packages for all major distributions, including Ubuntu, are available on the Check_MK project site. To download the package needed for our Ubuntu 14.04 Droplet, type:
wget http://mathias-kettner.de/download/check-mk-agent_1.2.4p5-2_all.deb
After downloading, install the package using:
dpkg -i check-mk-agent_1.2.4p5-2_all.deb
This time the installation should not fail, since all dependencies should have been satisfied already. We can verify that the agent has been successfully installed by running:
check_mk_agent
The command should output a very long text that looks like gibberish, but gathers all vital information about the system in one place. It is the output from this command that Check_MK uses to gather monitoring data.
Restricting Access to Monitoring Data
By default the data from check_mk_agent is served using xinetd, a mechanism that outputs data on a certain network port upon accessing it. This means that we can access the check_mk_agent by using telnet to port 6556 (the default port for Check_MK) from any other computer on the internet. Here is the proof (run these commands from your local computer or a different remote host, and replace the IP address below with your Droplet’s IP address):
[root@otherhost ~]$ telnet 12.34.56.78 6556
Output:
Trying 178.62.42.115...
Connected to 178.62.42.115.
Escape character is '^]'.
<<<check_mk>>>
Version: 1.2.4p5
AgentOS: linux
PluginsDirectory: /usr/lib/check_mk_agent/plugins
LocalDirectory: /usr/lib/check_mk_agent/local
SpoolDirectory: /etc/check_mk/spool
AgentDirectory: /etc/check_mk
(...)
It is not a good security policy to publish vital information about servers to anyone interested on the Internet. We should allow only hosts that run OMD and are under our supervision to access the data, so our monitoring system can gather it, but no one else.
To restrict access to the agent data, we have to edit the configuration file at /etc/xinetd.d/check_mk. Type:
nano /etc/xinetd.d/check_mk
Locate this section:
# configure the IP address(es) of your Nagios server here:
#only_from      = 127.0.0.1 10.0.20.1 10.0.20.2
The only_from setting is responsible for restricting access to certain IP addresses. Because we are now working on monitoring the same Droplet that OMD is on, it is ok to allow only localhost to connect. Uncomment and update the configuration setting to:
# configure the IP address(es) of your Nagios server here:
only_from      = 127.0.0.1
Save and exit the file.
The xinetd service has to be restarted for changes to take place. To do so, we have to execute:
service xinetd restart
Now the agent is up and running and restricted to accept only local connections. To test this, try the telnet command again from a remote location:
telnet 12.34.56.78 6556
Now we can proceed to configure monitoring for that host using Check_MK.
Configuring Host in Check_MK
To add a new host to monitor we have to go to the Hosts menu in the WATO Administration menu on the left, and then click Create new host. We will be asked for some information about the host.
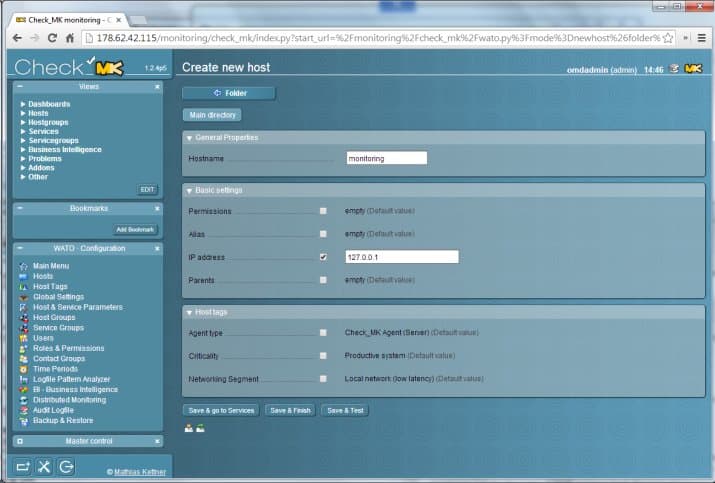
The Hostname is the familiar name that will be used for the monitoring. It may be a fully-qualified domain name, but it is not necessary. In this example we will name the host monitoring, just like the name of the OMD instance itself. Because monitoring is not resolvable to the IP address, we also have to provide the IP address of our Droplet. Since we are monitoring the localhost, the IP will simply be 127.0.0.1. Check the box to enable the IP setting.
The default agent type is already set to Check_MK agent, which is fine. The networking segment setting is used to denote hosts on remote networks, which are characterised by a higher expected latency that is not a sign of malfunction. Since it is a local host, the default setting is fine as well.
To save the host and configure which services will be monitored, click the Save & go to services button.
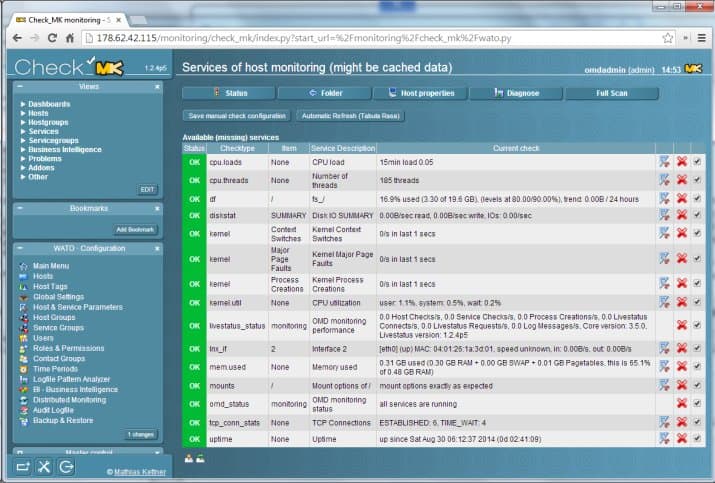
Check_MK will do an automatic inventory. That means it will gather the output from the agent and decipher it to know what kinds of services it can monitor. All available services for monitoring will be on the list, including CPU load, memory usage, and free space on disks. To save the available checks we have to click the Save manual check configuration button. This will redirect us to the screen with a list of available hosts with our host added.
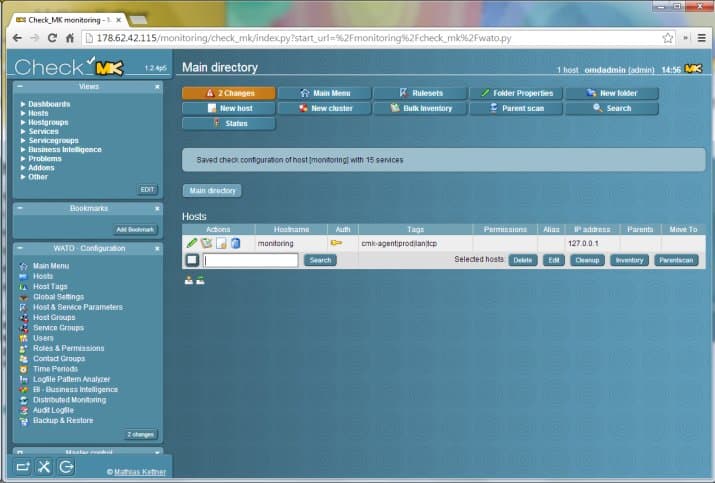
Just like with changing the user password, changes must be saved and activated before they will be fully taken into account. We have to press the 2 Changes button and accept the changes. After that the host monitoring will be up and running.
Working with Monitoring Data
Now let’s take a look at the main dashboard using the Dashboards/Main Overview menu item on the left.
The Earth sphere will now be fully green and the table will say that one host is up with no problems. We can see the full host list, now consisting of a single host, in the Hosts/All hosts view (using the menu on the left).
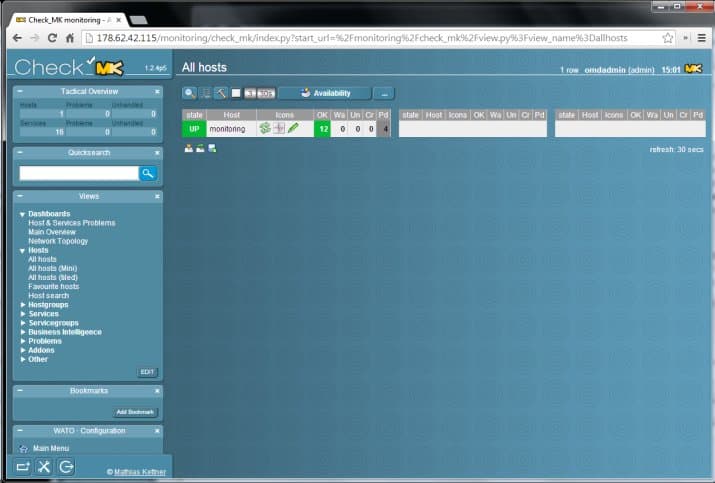
There we will see how many services are in good health (shown in green), how many are failing, and how many are yet pending to be checked. After clicking on the host name we will be able to see the list of all services with their full statuses and their Perf-O-Meters. Perf-O-Meter shows the performance of a single service relative to what Check_MK considers to be good health.
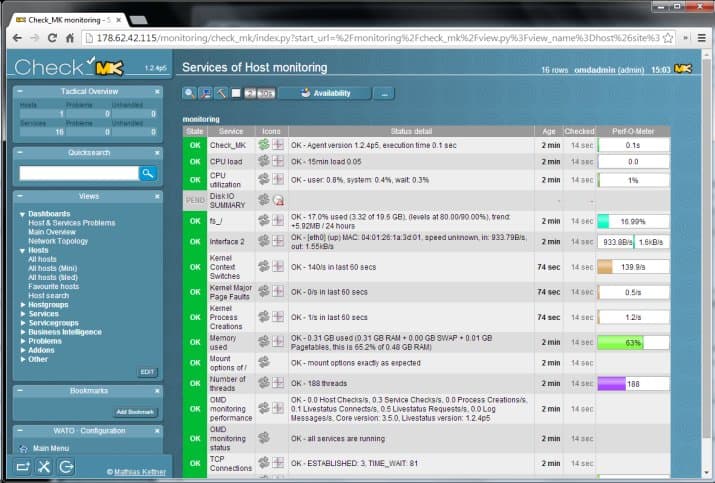
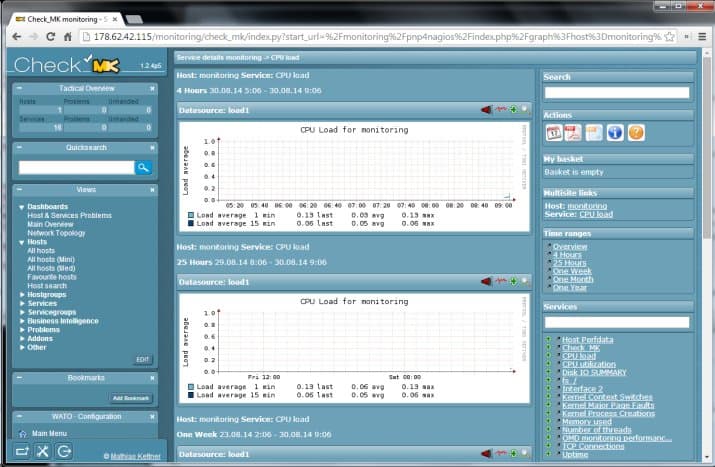
All services that return data that can be represented on a graph have a graph icon next to their name. We can use that icon to get access to graphs associated with the service. Since the host monitoring is fresh, there is almost nothing on the graphs - but after some time the graphs will provide valuable information on how the service performance changes over time.
When any of the services fails or recovers, information will be shown on the dashboard. For failing services a red error will be shown, and the problem will also be visible on the Earth graph.
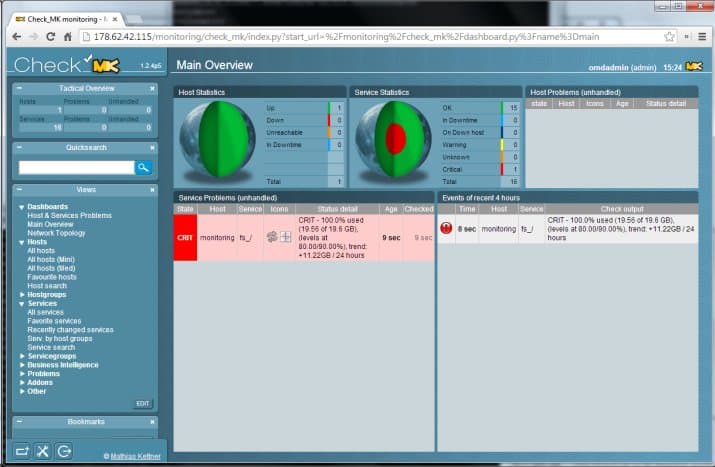
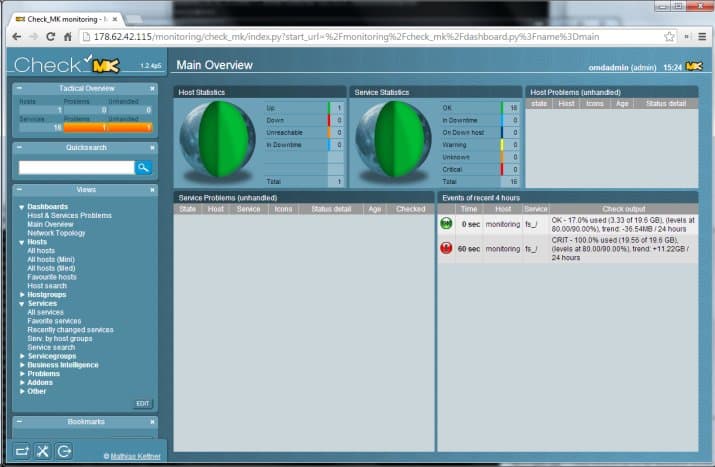
After recovery, everything will be shown in green as working properly, but the event log on the right will contain information about past failures.
Monitoring a Second CentOS Host
Monitoring gets really useful when you have multiple hosts. We will add a second Droplet to our OMD instance, running CentOS 7.0 x64.
Installing the Agent
Just like with our Ubuntu Droplet, installing Check_MK Agent is necessary to gather monitoring data. This time we will need an rpm package from the Check_MK project site. To download the package needed for our CentOS Droplet, type:
wget http://mathias-kettner.de/download/check_mk-agent-1.2.4p5-1.noarch.rpm
After downloading, install the package using:
yum install check_mk-agent-1.2.4p5-1.noarch.rpm
On CentOS xinetd is not installed by default, so yum will ask to install the dependency. Agree, and the package will be installed. Just like before, we can verify that the agent is working properly by executing check_mk_agent - the output will be similar to that from the first Droplet.
Restricting Access
This time we will not be monitoring a local host, so xinetd must allow the Droplet with OMD to gather the data. To allow that, start editing configuration file with:
nano /etc/xinetd.d/check_mk
and replace
    # configure the IP address(es) of your Nagios server here:
    #only_from      = 127.0.0.1 10.0.20.1 10.0.20.2
with
    # configure the IP address(es) of your Nagios server here:
    only_from      = your-omd-droplet-ip
Save and exit the file. Restart the xinetd service using:
service xinetd restart
We can now proceed to configure Check_MK to monitor our CentOS 7 host.
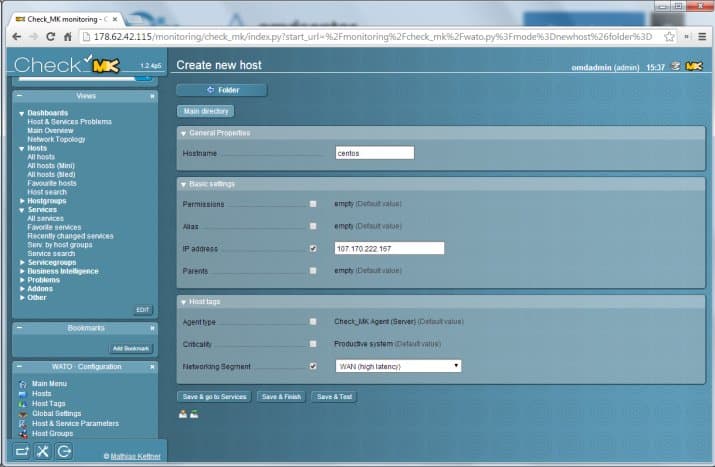
Configuring the New Host in Check_MK
To add additional hosts to Check_MK, we use the Hosts menu just like before. This time we will name the host centos, configure its IP address, and choose WAN (high-latency) since the host is on another network. Use the check boxes to enable the IP and networking settings. If we skipped this and left it as local, Check_MK would soon alert us that the host is down, since it would expect it to respond to agent queries much quicker than is possible over the Internet.
Click Save & go to Services, which will show services available for monitoring on the CentOS Droplet. The list will be very similar to the one from the first host. This time we also have to Save manual check configuration and activate the changes using the orange button on the top left corner.
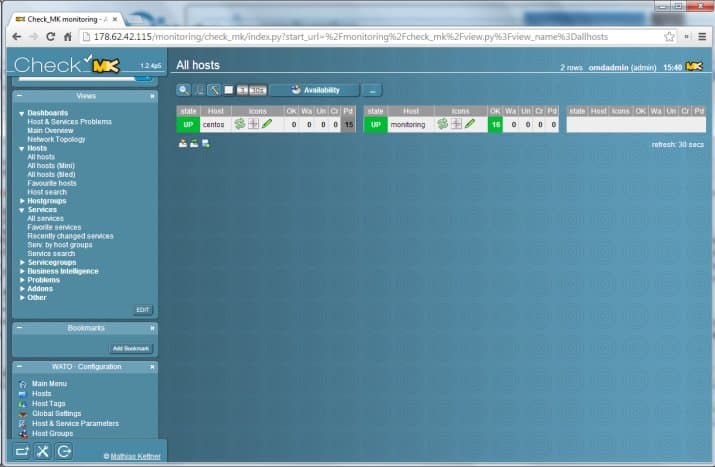
After activating the changes, we can verify that the host is monitored by going to the All hosts page. Two hosts, monitoring and centos, should now be visible.
Alerts of services failing and recovering will continue to show on the main dashboard for both hosts.
Adding More Hosts
It is possible to add multiple hosts for monitoring in Check_MK. There is no upper limit other than server performance, which should not be a problem until we are talking about hundreds. The procedure is the same for any other host. Check_MK agents in deb and rpm packages work not only on Ubuntu and CentOS but also on other Linux distributions.
Summary and Further Reading
Open Monitoring Distribution allows for easy setup of monitoring system based on Check_MK, which packs all the hard work into an easy-to-use web interface full of configuration options and features. With these tools it is possible to monitor multiple hosts, set up email notifications for problems, set up additional checks for more services, monitor accessibility and performance, and much, much more.
The documentation for Check_MK is available in English and is a comprehensive resource for Check_MK users and administrators.
Thanks for learning with the DigitalOcean Community. Check out our offerings for compute, storage, networking, and managed databases.
About the author(s)
Creating bespoke software ◦ CTO & co-founder at Makimo. I'm a software enginner & a geek. I like making impossible things possible. And I need tea.
Current fan and former Editorial Manager at DigitalOcean. Hi! Expertise in areas including Ubuntu, Docker, Rails, and more.
Still looking for an answer?
This textbox defaults to using Markdown to format your answer.
You can type !ref in this text area to quickly search our full set of tutorials, documentation & marketplace offerings and insert the link!
Excellent doc.
Please update about cisco Router, Switch and firewall monitoring guidelines/steps using snmp.
Please update the doc for centos instalation also.
Waiting for your response.
- Problem: can’t access Icinga web interface. Following message shows:
Whoops!
Error: Could not open main config file ‘/omd/sites/ibblnms/tmp/icinga/icinga.cfg’ for reading!
Here are some things you should check in order to resolve this error:
Make sure you've installed a main config file in its proper location. A sample main configuration file (named icinga.cfg) can be found in the sample-config/ subdirectory of the Icinga source code distribution.
Make sure the user your web server has permission to read the main config file.
Make sure you read the documentation on installing and configuring Icinga thoroughly before continuing. If everything else fails, try sending a message to one of the mailing lists. More information can be found at http://www.icinga.org.
- can’t access PNP4Nagios
PNP4Nagios Version 0.6.24 Please check the documentation for information about the following error.
perfdata directory “/omd/sites/ibblnms/var/pnp4nagios/perfdata/” is empty. Please check your Nagios config. <a href=“http://docs.pnp4nagios.org/faq/3”>Read FAQ online</a> file [line]:
application/models/data.php [109]:
back
Actions pnp4nagios-0.6.24 [ 30-07-2014 ]
All other site can access.
Please advice how can access Icinga and pnp4nagios
Very good DO team. This helped me a lot for a friend of mine with Ubuntu 14.04. server.
One thing is unclear to me. These install instructions aren’t working for my Ubuntu 12.04 server. Why is that? Of course i am a layman, but shouldn’t the commands work on both OS versions? Nevertheless, I managed to solve my problem by following this good read on how to install Nagios and Check_MK
Hi,
I have installed check_mk on centos 6 added host also in monitoring everything is working fine…but now i dont know how to monitor Tomcat in check_mk googled but not found any usefull link please help me with this…i am struggling from last 3 days but no success.
BR, Sunil Garje
@mati Thanks for the solid written guide for setting up OMD/CheckMK.
I was wondering, have you or anyone else had any problems with updates of OMD?
I have been evaluating OMD in our environment, but ran into a problem with updates. Our environment is CentOS/RHEL using rpm/package management for omd and subscribed to the proper repo, but when OMD 1.20 was released we noticed no automatic updates occurred with them because the naming convention for the package seems off. I wonder if the same occurred in Ubuntu?
(TL;DR: We did not have a automatic upgrade path from OMD 1.10 to 1.20)
Here is part of the problem - the version is in the name of the package, not the version field.
# yum list omd*
Loaded plugins: refresh-packagekit, rhnplugin, security
This system is receiving updates from RHN Classic or RHN Satellite.
Installed Packages
omd-1.10.x86_64                                   rh61-31                                   @labs_consol_stable
Available Packages
omd-1.20.x86_64                                   rh61-33                                   labs_consol_stable

# yum list php
Loaded plugins: refresh-packagekit, rhnplugin, security
This system is receiving updates from RHN Classic or RHN Satellite.
Installed Packages
php.x86_64                                 5.3.3-40.el6_6                                 @rhel-x86_64-server-6
Thanks for this, It works excelent, nowadays I use Nagios, and I change for OMD. I like configure in detail. Do you have more information ? manuals? etc. Gabriel
Thanks for the tutorial. I have an Ubuntu 14.04 server customised with Server Pilot, so the default path to IP/monitoring returns a 404 Not Found. Do you know how I can configure the Nginx/Apache setup to allow a path to IP/monitoring?
Hello. I am using the latest version of check_mk 1.2.4p.5 but the emails are not working properly. I am getting maybe one email over a few days. Has anyone has this issue.
Check_mk is suppose to be great but I am having doubts. Any thoughts? Maybe leaning toward trying Zenoss or purchasing a product with a name and maturity behind it.
 This work is licensed under a Creative Commons Attribution-NonCommercial- ShareAlike 4.0 International License.
Become a contributor for community
Get paid to write technical tutorials and select a tech-focused charity to receive a matching donation.

DigitalOcean Documentation
Full documentation for every DigitalOcean product.

Resources for startups and AI-native businesses
The Wave has everything you need to know about building a business, from raising funding to marketing your product.
The developer cloud
Scale up as you grow — whether you're running one virtual machine or ten thousand.

Start building today
From GPU-powered inference and Kubernetes to managed databases and storage, get everything you need to build, scale, and deploy intelligent applications.
