By Scott Lee and Sharon Campbell

Introduction
Ganglia is a scalable distributed monitoring system. It scales well with very large numbers of servers and is useful for viewing performance metrics in near real-time.
On the back end, Ganglia is made up of the following components:
- Gmond (Ganglia monitoring daemon): a small service that collects information about a node. This is installed on every server you want monitored.
- Gmetad (Ganglia meta daemon): a daemon on the master node that collects data from all the Gmond daemons (and other Gmetad daemons, if applicable).
- RRD (Round Robin Database) tool: a tool on the master node used to store data and visualizations for Ganglia in time series.
- PHP web front-end: a web interface on the master node that displays graphs and metrics from data in the RRD tool.
Basically, every node (server) that you want monitored has Gmond installed. Every node uses Gmond to send data to the single master node running Gmetad, which collects all the node data and sends it to the RRD tool to be stored. You can then view the data in your web browser with the help of the PHP scripts and Apache.
Here’s a diagram of a functioning Ganglia grid, with the master node shown as the Ganglia Server running the Gmetad daemon, and the other nodes shown as connecting servers running the Gmond daemon:
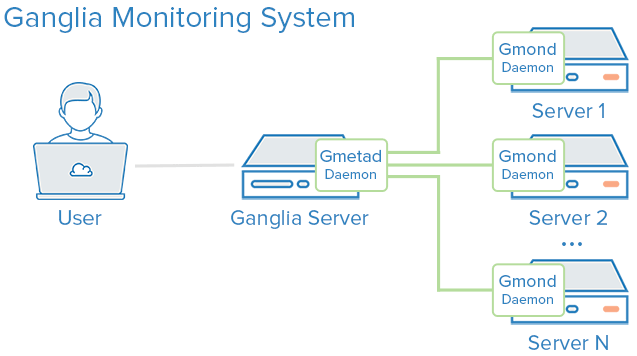
When you use the web interface to view the monitored data, the data is organized on several levels. Ganglia organizes nodes, which are individual monitored machines, into clusters, which are groups of similar nodes. On a higher level, collections of clusters can also be organized into grids. You’ll see this organization when you log into the web interface.
In this article, we will first be setting up a single cluster called my cluster, with two nodes. Later, we will set up a single grid named London with two clusters, Servers and Databases. The examples will show two nodes in each cluster.
Prerequisites
You will need:
- One master node Droplet running Ubuntu 14.04. This is the node you will use to view all of the monitoring data.
- At least one additional node that you want to monitor, running Ubuntu 14.04
- If you want to match the grid examples exactly, you should have two more nodes running Ubuntu 14.04. However, you can easily complete the tutorial with just one node on each cluster.
Create a sudo user on each Droplet. First, create the user with the adduser command, replacing the username with the name you want to use.
adduser username
This will create the user and the appropriate home directory and group. You will be prompted to set a password for the new user and confirm the password. You will also be prompted to enter the user’s information. Confirm the user information to create the user.
Next, grant the user sudo privileges with the visudo command.
visudo
This will open the /etc/sudoers file. In the User privilege specification section, add another line for the created user so it looks like this (with your chosen username instead of username):
# User privilege specification
root       ALL=(ALL:ALL) ALL
username   ALL=(ALL:ALL) ALL
Save the file and switch to the new user.
su - username
Update and upgrade the system packages.
sudo apt-get update && sudo apt-get -y upgrade
Installation
On the master node, install Ganglia monitor, RRDtool, Gmetad, and the Ganglia web front end.
sudo apt-get install -y ganglia-monitor rrdtool gmetad ganglia-webfrontend
During installation, you will be asked to restart Apache. Select yes. Depending on your system, you may be asked twice. Select yes again.
Set up the online graphical dashboard by copying the Ganglia web front end configuration file to the Apache sites-enabled folder.
sudo cp /etc/ganglia-webfrontend/apache.conf /etc/apache2/sites-enabled/ganglia.conf
Optional: You may want to password-protect this site for increased security. Otherwise, it will be open to the Internet, and you may not wish to expose your server configurations and IP addresses.
Note: This section and the Client Installation section show a simpler setup involving a single cluster, named my cluster. If you want to set up the grid and both clusters right away, you may want to reference the settings in the Grids section as well.
Edit the Gmetad configuration file to set up your cluster. This file configures where and how the Getad daemon will collect data.
sudo vi /etc/ganglia/gmetad.conf
Find the line that begins with data_source, as shown below:
data_source "my cluster" localhost
Edit the data_source line to list the name of your cluster, the data collection frequency in seconds, and your server’s connection information. In the example below, the data source is called my cluster, and it collects metrics once a minute from the localhost (itself). You can add more data_source lines to create as many clusters as you want.
data_source "my cluster" 60 localhost
Save your changes.
Next, edit the Gmond configuration file. Even though this is the master node, we are also setting it up for monitoring as the first node in the “my cluster” cluster. The gmond.conf file configures where the node sends its information.
sudo vi /etc/ganglia/gmond.conf
In the cluster section, make sure you set the name to the same one you set in the gmetad.conf file, which in this example is my cluster. The rest of the fields are optional and can be left as unspecified.
For reference, the owner value specifies the administrator of the cluster, which is useful for contact purposes. The latlong value sets the latitude and longitude coordinates for globally distributed clusters. The url value is for a link to provide more information about the cluster.
[...]
cluster {
  name = "my cluster" ## use the name from gmetad.conf
  owner = "unspecified"
  latlong = "unspecified"
  url = "unspecified"
}
[...]
In the udp_send_channel section, insert a new host line with the value localhost, which is the server where you’re sending the information. Comment out the mcast_join line.
For reference, the mcast_join value provides a multicast address, but we need to send the data to only one host, so this is unnecessary. (If you later decide you want to create a grid for this cluster, you will re-enable it.)
[...]
udp_send_channel   {
  #mcast_join = 239.2.11.71 ## comment out
  host = localhost
  port = 8649
  ttl = 1
}
[...]
In the udp_recv_channel section, comment out the mcast_join and bind lines. (Again, if you want to add this cluster to a grid, you will re-enable these lines.)
The bind value provides a local address to bind to, but since the cluster will only be sending information, this is unncessary.
[...]
udp_recv_channel {
  #mcast_join = 239.2.11.71 ## comment out
  port = 8649
  #bind = 239.2.11.71 ## comment out
}

/* You can specify as many tcp_accept_channels as you like to share
   an xml description of the state of the cluster */
tcp_accept_channel {
  port = 8649
}
[...]
Restart Ganglia-monitor, Gmetad and Apache.
sudo service ganglia-monitor restart && sudo service gmetad restart && sudo service apache2 restart
Web Interface
Ganglia should now be set up and accessible at http://ip-address/ganglia.
The main page shows the grid view, which is an overview of your monitored nodes. Right now there should be just one: localhost.
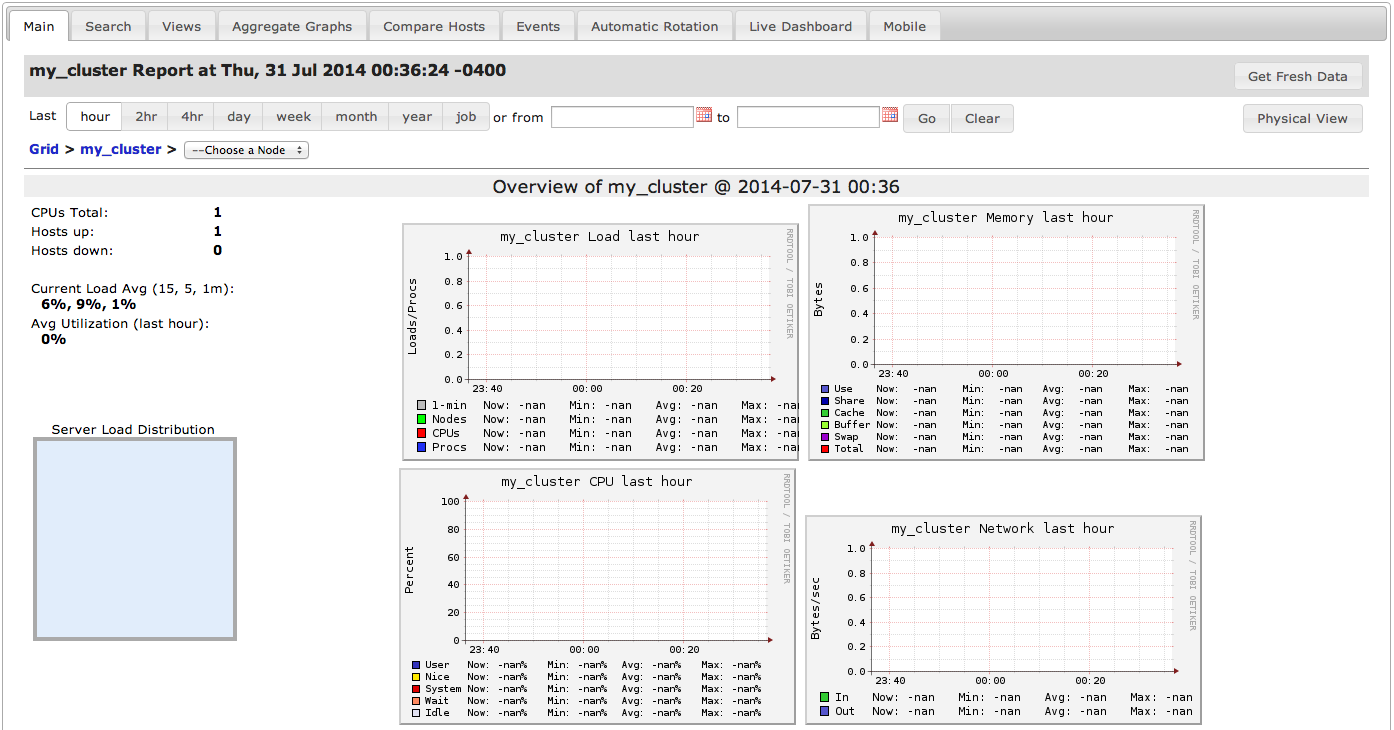
The main tab allows you to view the data from set and custom time increments. You can also manually refresh the data by clicking the Get Fresh Data button in the top right.

Below the time range selection, you can choose a specific node from the dropdown menu labeled –Choose a Node. Right now, localhost should be the only node you see.
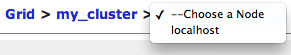
Select localhost from the list to see information specific to the localhost node. Since localhost is the only node being monitored, the information on the localhost node page and the main tab will be the same.
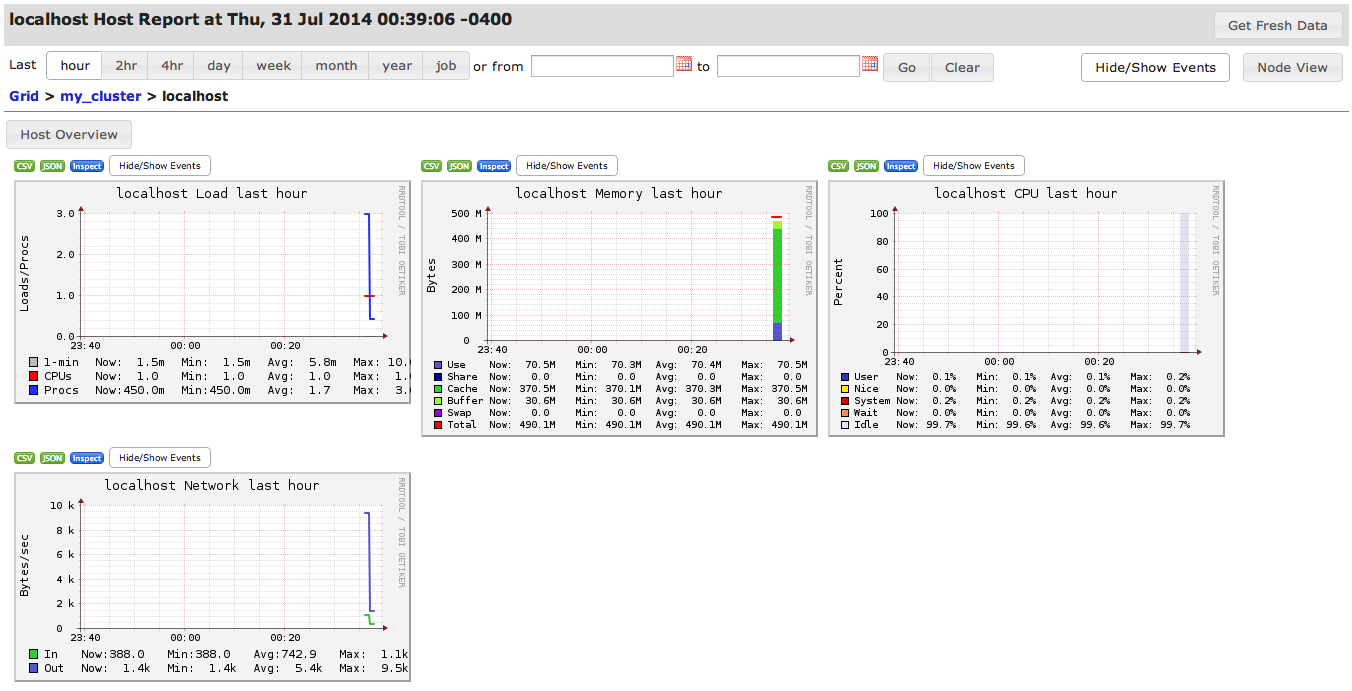
From here, you can also click the Node View button in the upper right to view contextual information about the node.
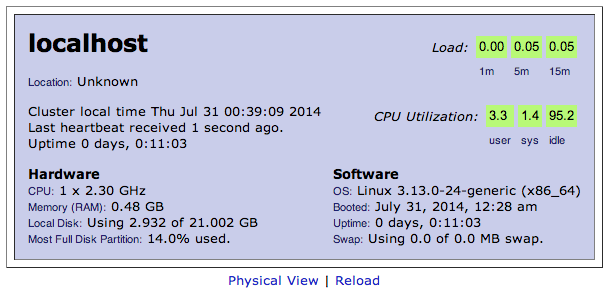
The rest of the main page displays a summary of the node’s clusters. Click on any graph to view detailed information by various time increments, from one hour to one year, as well as to export graph data in CSV or JSON formats.
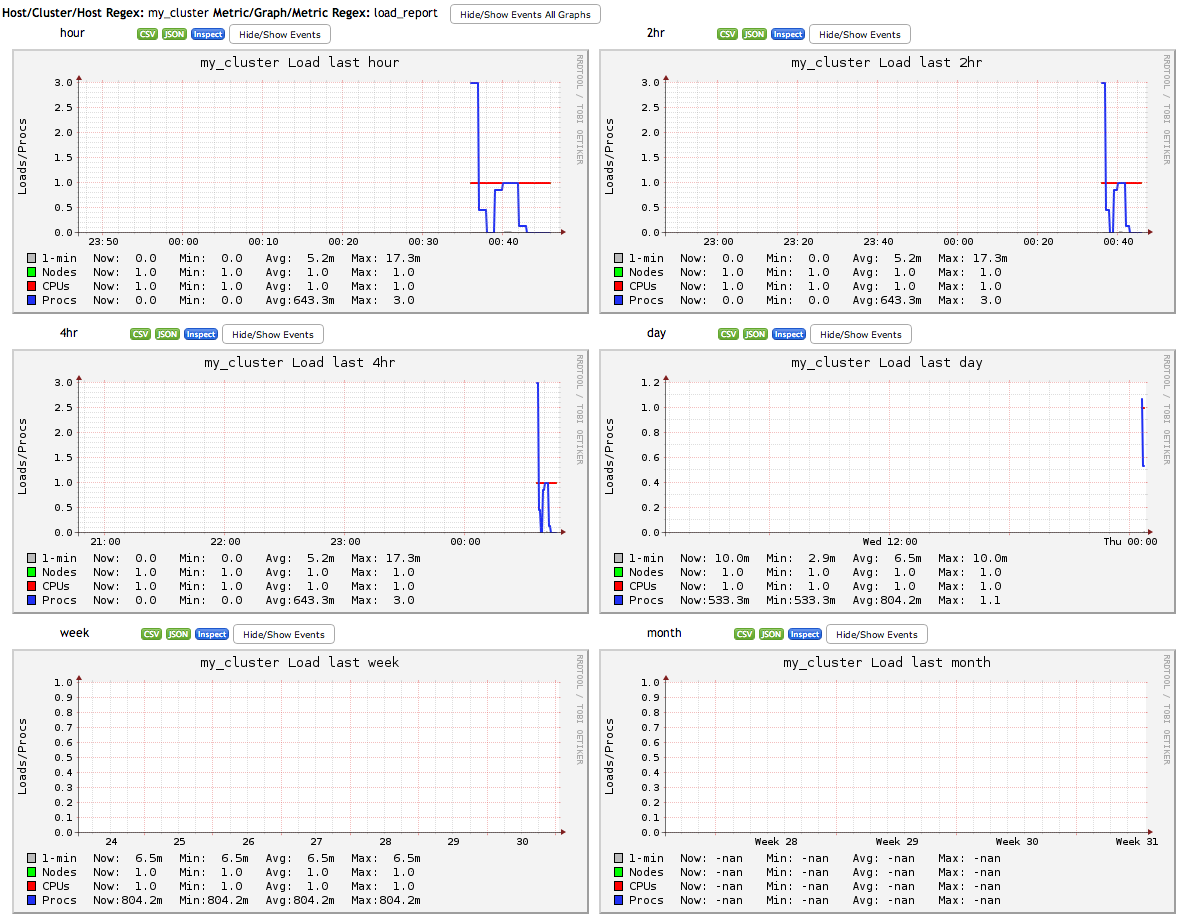
As your nodes grow and viewing them all on the main page becomes difficult, you can use the search tab to find particular hosts or metrics, using regular expressions. You can also compare hosts, create custom aggregate graphs, and more.
Client Installation
On the second node you want to monitor in the my cluster cluster, install the Ganglia monitor.
sudo apt-get install -y ganglia-monitor
Edit the Gmond configuration file for monitoring the node.
sudo vi /etc/ganglia/gmond.conf
Just like we did on the master node, update the cluster name (my cluster in this example) in the cluster section so it matches the name on the master node.
[...]
cluster {
  name = "my cluster"     ## Cluster name
  owner = "unspecified"
  latlong = "unspecified"
  url = "unspecified"
[...]
Add a line to the udp_send_channel block for the host, which should be the IP address of your master Ganglia node (e.g. 1.1.1.1). Comment out the mcast_join line.
[...]
udp_send_channel {
  #mcast_join = 239.2.11.71   ## Comment
  host = 1.1.1.1   ## IP address of master node
  port = 8649
  ttl = 1
}
[...]
Comment out the whole udp_recv_channel section with the /* ... */ syntax, as this server won’t be receiving anything.
[...]
/* You can specify as many udp_recv_channels as you like as well.
udp_recv_channel {
  mcast_join = 239.2.11.71
  port = 8649
  bind = 239.2.11.71
}
*/
[...]
Restart the monitoring service.
sudo service ganglia-monitor restart
Wait a few minutes and reload the web interface. The new node should appear in the cluster automatically.
Repeat these steps on any other nodes you want to monitor in this cluster.
You now have a cluster! You can view the overview of your cluster on the web interface, and drill down into specific nodes as well as particular metrics.

Grids
Grids allow you to organize several clusters together. For instance, if you have several clusters of MySQL databases serving different applications, you can organize all of those clusters in the same grid to view the performance of all your MySQL servers. Or if you have application servers all over the world, you can put them in a grid by location, such as London.
To create a grid, edit the /etc/ganglia/gmetad.conf file on the Ganglia master node.
Please note that you can create only one grid per Gmetad. If you want to create more than one grid you need to install Gmetad on another server. In this example, we will call our grid London.
sudo vi /etc/ganglia/gmetad.conf
Name your grid in the grid section by uncommenting the gridname line and replacing MyGrid with the grid name of your choice. In this example, we will name the grid London.
# The name of this Grid. All the data sources above will be wrapped in a GRID
# tag with this name.
# default: unspecified
# gridname "MyGrid"
For instance, if you are creating your grid for all of your London servers:
gridname "London"
Add or edit a new data_source line for every cluster you want in this grid.
Update the name for the cluster, and then add host and port information for each server you want to add to that cluster. Please note that clusters are identified by the port number, so each new data_source line, or cluster, should use a different port number.
For instance, in the example below, we are adding two clusters, called Servers and Databases, to the London grid. All of the nodes in Servers are using port 8556, and all of the nodes in Databases are using port 8857.
data_source "Servers" localhost 1.1.1.2:8556
data_source "Databases" 1.2.1.1:8557 1.2.1.2:8557
On each server (or node) specified in the Gmetad configuration file (in this example, localhost, 1.1.1.2, 1.2.1.1, and 1.2.1.2), edit the Gmond configuration file.
sudo vi /etc/ganglia/gmond.conf
Update the name value in the cluster section to match the cluster name. Here, we’ll set up a node to be part of the Databases cluster. (Note that if you set up two nodes using the earlier method, you will have to go back and edit the /etc/ganglia/gmond.conf file on each of them to match the new settings.)
/* If a cluster attribute is specified, then all gmond hosts are wrapped inside
 * of a <CLUSTER> tag.  If you do not specify a cluster tag, then all <HOSTS> will
 * NOT be wrapped inside of a <CLUSTER> tag. */

cluster {
  name = "Databases"
  owner = "unspecified"
  latlong = "unspecified"
  url = "unspecified"
}
Also, unlike in the previous sections, you should not comment out the mcast_join lines.
Your udp_send_channel block should look like this. Make sure to update the port number! In our example, since this is part of the Databases cluster, the port should be 8557. The other lines can stay the same.
udp_send_channel {
mcast_join = 239.2.11.71
port = 8557
ttl = 1
}
Your udp_recv_channel block should look like this, using the appropriate port number. The other lines can stay the same.
udp_recv_channel {
mcast_join = 239.2.11.71
port = 8557
bind = 239.2.11.71
}
Finally, your tcp_accept_channel block should look like this, using the appropriate port number.
tcp_accept_channel {
port = 8557
}
Restart the monitoring services on each node.
sudo service ganglia-monitor restart
Restart Ganglia-monitor, Gmetad and Apache on the Ganglia host server or master node.
sudo service ganglia-monitor restart && sudo service gmetad restart && sudo service apache2 restart
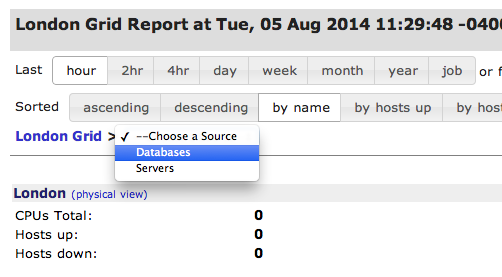
In the web interface, you should now see the name of your grid, and the option to choose a cluster. From there you can select and drill down into a node.
Conclusion
Ganglia is very easy to set up and scale up from one node to hundreds or thousands. It features a high performance level and can help you monitor as many servers as you need.
Thanks for learning with the DigitalOcean Community. Check out our offerings for compute, storage, networking, and managed databases.
About the author(s)
Hey!
Current fan and former Editorial Manager at DigitalOcean. Hi! Expertise in areas including Ubuntu, Docker, Rails, and more.
Still looking for an answer?
This textbox defaults to using Markdown to format your answer.
You can type !ref in this text area to quickly search our full set of tutorials, documentation & marketplace offerings and insert the link!
Hi Scott! Congratulations! This cool is article. But, after installation of the Ganglia Client, the graphics are showing this message: “No matching metrics detected or RRDs not readable” and others graphics are showing “No matching metrics detected”.
Thank you!
I using CentOS 6.5 and I’m compiling ganglia from source. The machine running gmetad should be compiled with –with-gmetad option enabled. When I type this command ./ configure --with-gmetad, I get this error message : <<The Ganglia Meta Daemon uses the Round-Robin Database Tool (rrdtool) for storing historical information. You have chosen to compile the monitoring core with gmetad but librrd could not be found. Please visit http://www.rrdtool.org/, download rrdtool and then try again>>
But the rrdtool is already installed. How can this be solved??
Thank you
Hi Your article is great.
However, Does Ganglia support Email alert, monitoring port and process? I dont’ find Ganglia provides such functionality but others monitoring tools seems have.
Hi,
Great article, but I recommend setting deaf = yes in /etc/ganglia/gmond.conf on the Ganglia clients (not the master). My Ganglia clients were using 100% CPU when deaf was set to no. See below for a couple other instances of this.
http://managing.blue/2015/05/27/gmond-occupying-100-of-the-cpu/
http://sourceforge.net/p/ganglia/mailman/message/31946143/
This article is great, but there is currently a problem with it with regards to the version apt-get is currently installing in 14.04 (gmond 3.6.0). Commenting out this whole section like this:
/* You can specify as many udp_recv_channels as you like as well. udp_recv_channel { mcast_join = 239.2.11.71 port = 8649 bind = 239.2.11.71 } */
Causes problems. Running gmond and looking at the output shows lots of, “apr_pollset_poll returned unexpected status 22 = Invalid argument” As lmm5247 says, setting “deaf = yes” will cure this.
 This work is licensed under a Creative Commons Attribution-NonCommercial- ShareAlike 4.0 International License.
Become a contributor for community
Get paid to write technical tutorials and select a tech-focused charity to receive a matching donation.

DigitalOcean Documentation
Full documentation for every DigitalOcean product.

Resources for startups and AI-native businesses
The Wave has everything you need to know about building a business, from raising funding to marketing your product.
The developer cloud
Scale up as you grow — whether you're running one virtual machine or ten thousand.

Start building today
From GPU-powered inference and Kubernetes to managed databases and storage, get everything you need to build, scale, and deploy intelligent applications.
