Microsoft MVP

In the modern landscape of IT environments, Linux is the cornerstone of enterprise infrastructure. Whether it is hosting critical cloud applications, driving big data analysis, or managing network-intensive workloads, Linux serves as the platform of choice due to its flexibility, performance, and open source nature. However, the out-of-the-box configuration of Linux, particularly at the kernel level, might not be optimized for high-performance requirements. To fully exploit Linux’s capabilities, system administrators must delve into kernel tuning – the process of adjusting key kernel parameters to align with specific performance goals. This article describes some of the tools and techniques the experts use to achieve better performance for their Linux systems.
Key Takeaways
- Performance profiling tools (
perf,ftrace,bpftrace) provide comprehensive system analysis capabilities, from high-level CPU metrics to deep kernel function tracing and custom memory allocation monitoring - TCP/IP optimization through kernel parameter tuning (
tcp_max_syn_backlog,tcp_rmem,tcp_wmem) significantly improves network performance for high-concurrency and high-bandwidth applications - Advanced congestion control algorithms like BBR reduce network latency by controlling congestion windows based on bandwidth and RTT rather than packet loss
- NUMA-aware tuning optimizes performance in multi-socket systems by aligning network interfaces, memory, and CPU cores to minimize cross-node access delays
- Memory management optimization through tools like valgrind and bpftrace helps identify memory leaks, fragmentation, and inefficient allocation patterns
- I/O performance tuning using iostat and scheduler optimization prevents disk bottlenecks and improves overall system responsiveness
- Kernel parameter persistence through
/etc/sysctl.confensures performance optimizations survive system reboots and maintain consistent performance
Profile and Benchmarking
In a world where Linux servers power everything from cloud environments to critical production systems, understanding how to fine-tune performance is essential. Whether you’re managing high-throughput web servers, data-heavy applications, or low-latency systems, knowing how to profile, benchmark, and interpret performance data is a crucial skill. Understanding the intricacies of Linux kernel performance requires precise and advanced tools. In this case, I’ll focus on three essential utilities: perf, ftrace, and bpftrace. Each tool serves a specific purpose and will help capture key data, from high-level performance metrics to deep kernel tracing.
Profiling CPU, Memory, and I/O
perf is the Swiss Army knife of Linux performance tools. Designed for developers and sysadmins alike, perf provides detailed statistics for understanding CPU usage, memory allocation, I/O, and much more. By tapping into kernel counters, perf reveals which parts of your system are under the most strain.
I’ll start with an example. Suppose you’re noticing system slowdowns and suspect a CPU bottleneck. The following command will allow you to quickly capture and analyze CPU data:
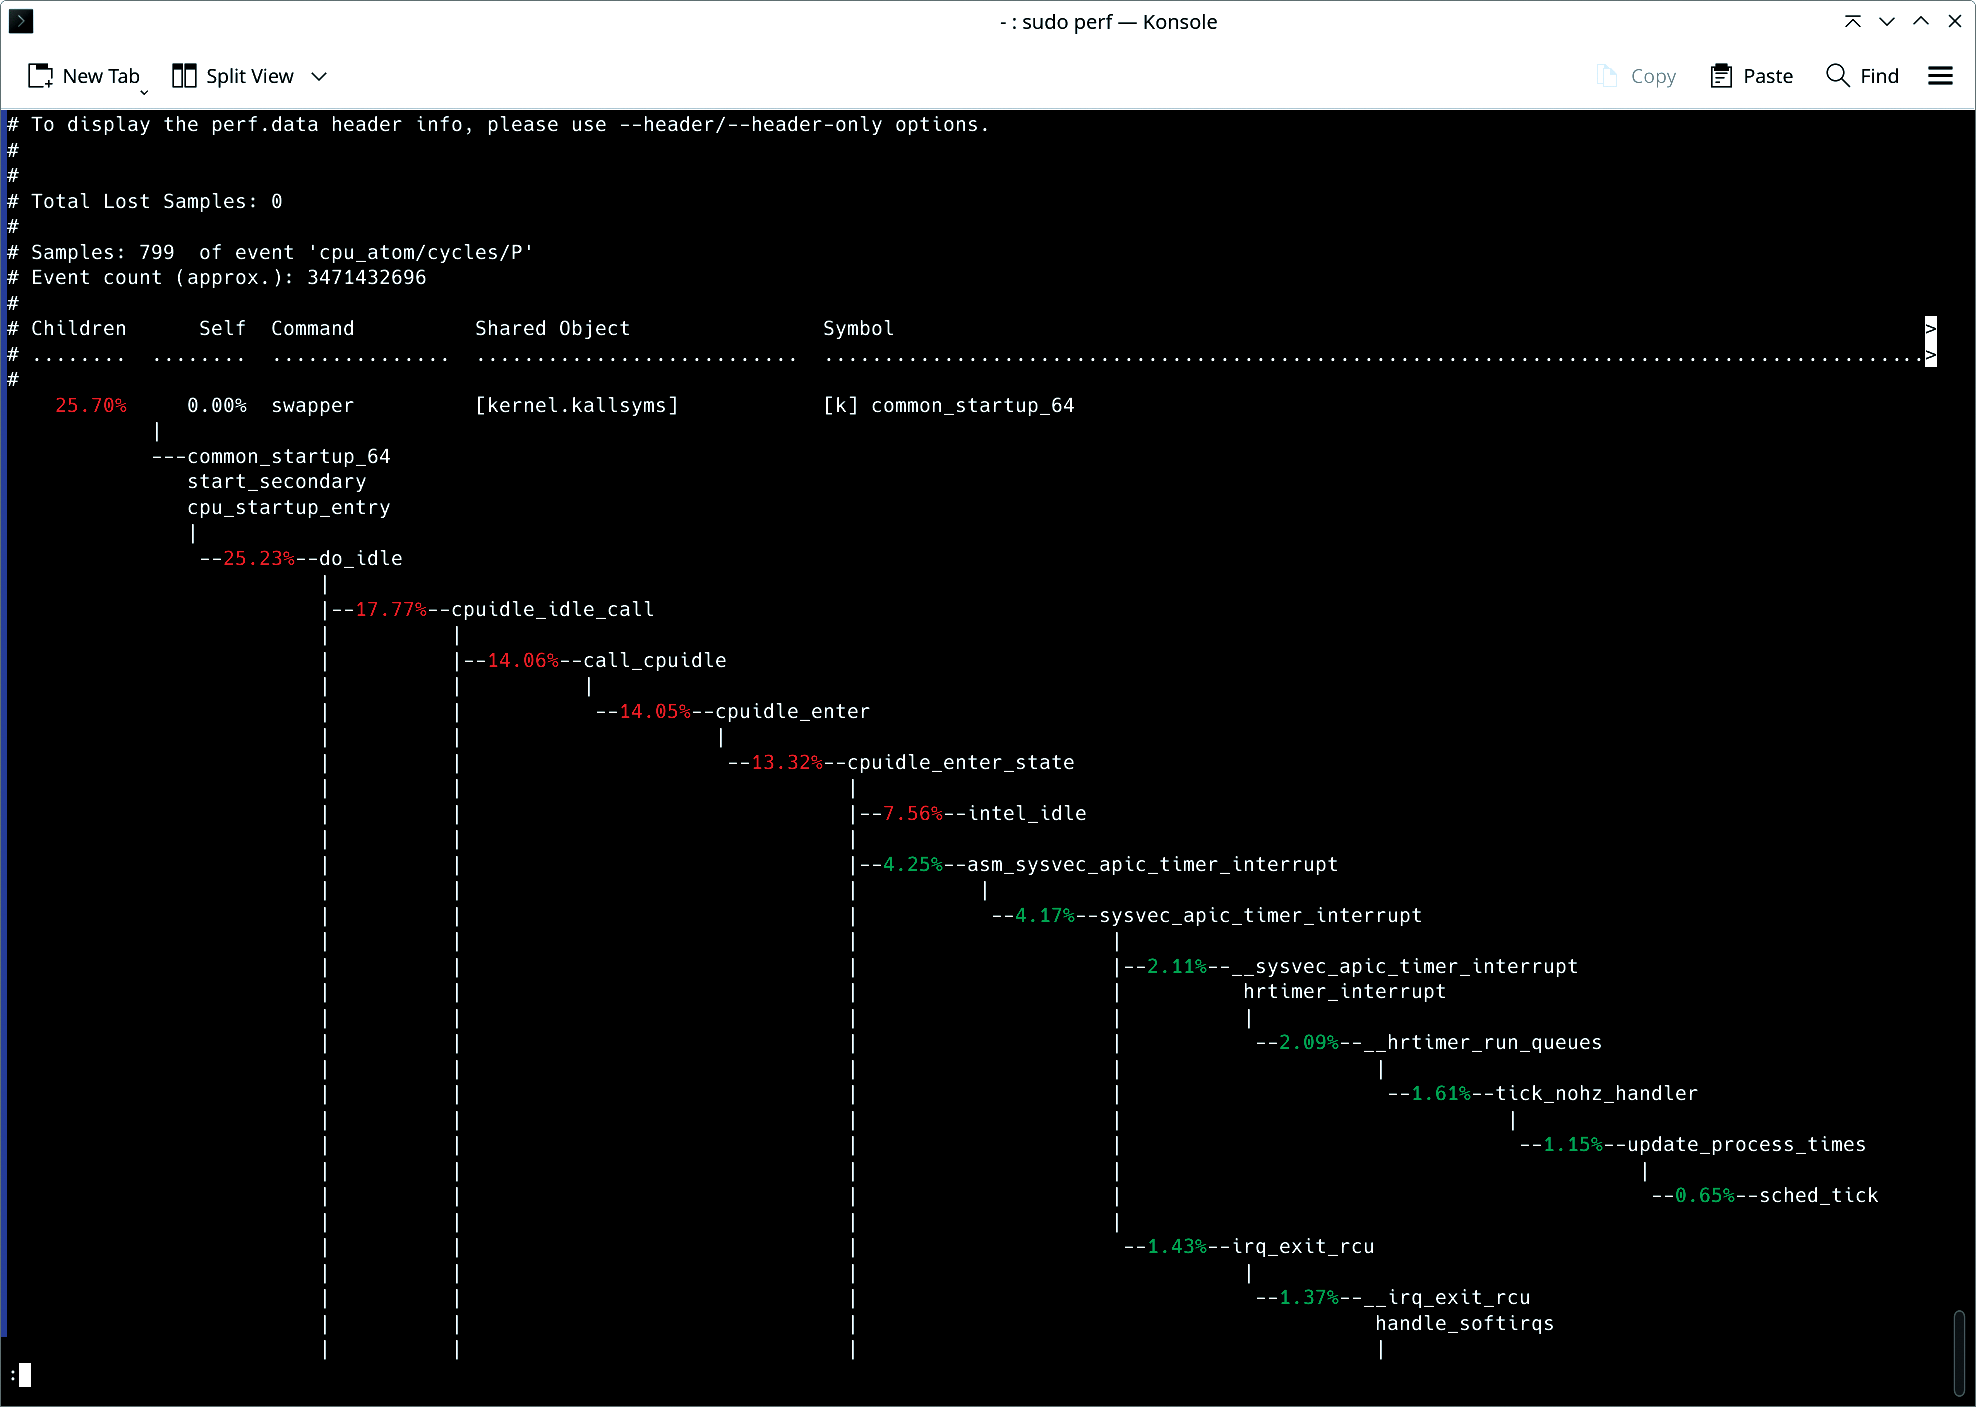
sudo perf record -F 99 -a --call-graph dwarf sleep 30
This command tells perf to sample the system at a frequency of 99 Hz (-F 99), profiling all CPUs (-a) for 30 seconds. The --call-graph dwarf flag enables capturing function call traces, helping you identify the hottest paths in the application’s execution.
Once the data is recorded, you can analyze it with:
sudo perf report --stdio
The report gives a visual of where CPU cycles are spent. For advanced users, the flamegraph-style call graph will expose deep insights into function-level execution, showing exactly where time is spent in code. This is especially useful for identifying functions that are unnecessarily consuming CPU cycles, enabling developers to optimize hot paths and reduce system load.
As an additional example, suppose you’re managing a high-traffic web application and suspect that some of your services are not handling CPU resources efficiently. Using perf, you can profile the system to capture key metrics such as instruction counts, cache misses, and branch mispredictions:
sudo perf stat -e cycles,instructions,cache-misses,branches,branch-misses ./web_service
This command profiles the web_service executable, capturing low-level CPU events such as:
- cycles: total number of CPU cycles spent
- instructions: total instructions executed
- cache-misses: number of cache misses during execution
The ratio of cycles to instructions can indicate whether your application is CPU-bound (high cycles per instruction) or suffers from inefficiencies like cache misses. This information is especially important in cloud environments, where maximizing resource efficiency translates directly to cost savings.
If perf reveals high instruction counts and significant cache misses, you might need to optimize your application’s code paths. Reducing the number of instructions executed per cycle can significantly reduce CPU load, especially in CPU-bound workloads such as data-processing pipelines.
Kernel Function Tracing for Low-Level Analysis
Although perf excels at providing a high-level overview, sometimes you need to dive deeper into kernel functions. ftrace gives you this low-level control, allowing you to trace and measure the execution of specific kernel functions.
Suppose you’re troubleshooting an application that’s experiencing high latency during disk writes. By tracing the kernel’s sys_enter_write function, you can observe exactly when the write system call occurs, how long it takes, and whether any unexpected delays are occurring:
echo function > /sys/kernel/debug/tracing/current_tracerecho sys_enter_write > /sys/kernel/debug/tracing/set_ftrace_filtercat /sys/kernel/debug/tracing/trace_pipe
This setup instructs ftrace to trace the sys_enter_write function, which handles write operations at the kernel level. By examining the output in trace_pipe, you can watch each call in real time. This approach provides critical insights into potential disk I/O delays, such as high disk latency or contention issues.
Combining ftrace with user-space applications allows for a full-stack performance analysis, bridging the gap between application behavior and kernel performance.
Programmable Tracing for Custom Metrics
When default tools aren’t enough, bpftrace shines. Built on the Berkeley Packet Filter (BPF) framework, bptrace enables customizable, programmable tracing scenarios. If you’re looking to go beyond the limitations of perf or ftrace, bpftrace offers powerful ways to trace kernel and user-space programs in real time.
In my case, I need to trace all memory allocations across the system, especially in a cloud environment with dynamic workloads. With bpftrace, I can create custom scripts that track every kmalloc (kernel memory allocation) event.
sudo bpftrace -e 'tracepoint:kmem:kmalloc { printf("Allocated %d bytes\n", args->bytes_alloc); }'
This command uses a tracepoint to track every kernel memory allocation (kmalloc), printing out the number of bytes allocated each time. This helps diagnose memory management issues, such as memory leaks or fragmentation problems in high-performance systems. It is especially useful when working with systems that deal with unpredictable memory usage, like database servers or cloud-hosted applications. You can further customize bpftrace scripts to capture only allocations over a certain size or to combine multiple tracepoints into a single performance report. This flexibility provides unparalleled visibility into your system’s memory management, enabling highly targeted optimizations.
Memory Profiling
Memory profiling helps you track how an application allocates and manages memory. This information is crucial in environments where memory is limited. If your system runs into ``Out of Memory’’ (OOM) errors, identifying and fixing memory leaks or inefficient usage becomes a top priority. You can profile a memory-intensive application with massif, which is part of the valgrind suite:
valgrind --tool=massif --time-unit=B ./memory_hungry_app
massif tracks memory allocation over time. By setting the time unit to bytes (–time-unit=B), you get precise measurements for how much memory is allocated and when peaks occur.
To visualize the results use:
ms_print massif.out.<pid>
This output reveals which functions are allocating the most memory, allowing you to optimize or rework memory-heavy code sections. In cloud environments, this kind of analysis is essential to prevent applications from over-consuming memory, which can lead to crashes or degraded performance under heavy load.
Excessive memory allocation, frequent paging, or out-of-memory (OOM) errors can often be traced back to inefficient memory management. By using tools such as bpftrace and valgrind, you can track down the exact points where memory issues occur. Once the problems are identified, optimizations might include increasing physical memory, adjusting vm.swappiness (to reduce swapping), or optimizing application memory allocation patterns.
I/O Profiling
Disk and network I/O often become the bottleneck in high-performance systems. Understanding how I/O requests are processed, whether they originate from the disk or network interfaces, is key to improving performance in data-driven workloads.
Consider a scenario where database queries are performing more slowly than expected. Using iostat, you can determine whether the bottleneck is disk I/O related:
iostat -dx 5
This command provides detailed disk I/O statistics, updating every five seconds (Figure 2). Key metrics include:
- await – the average time (in milliseconds) that I/O requests spend in the queue
- svctm – the average service time for I/O requests
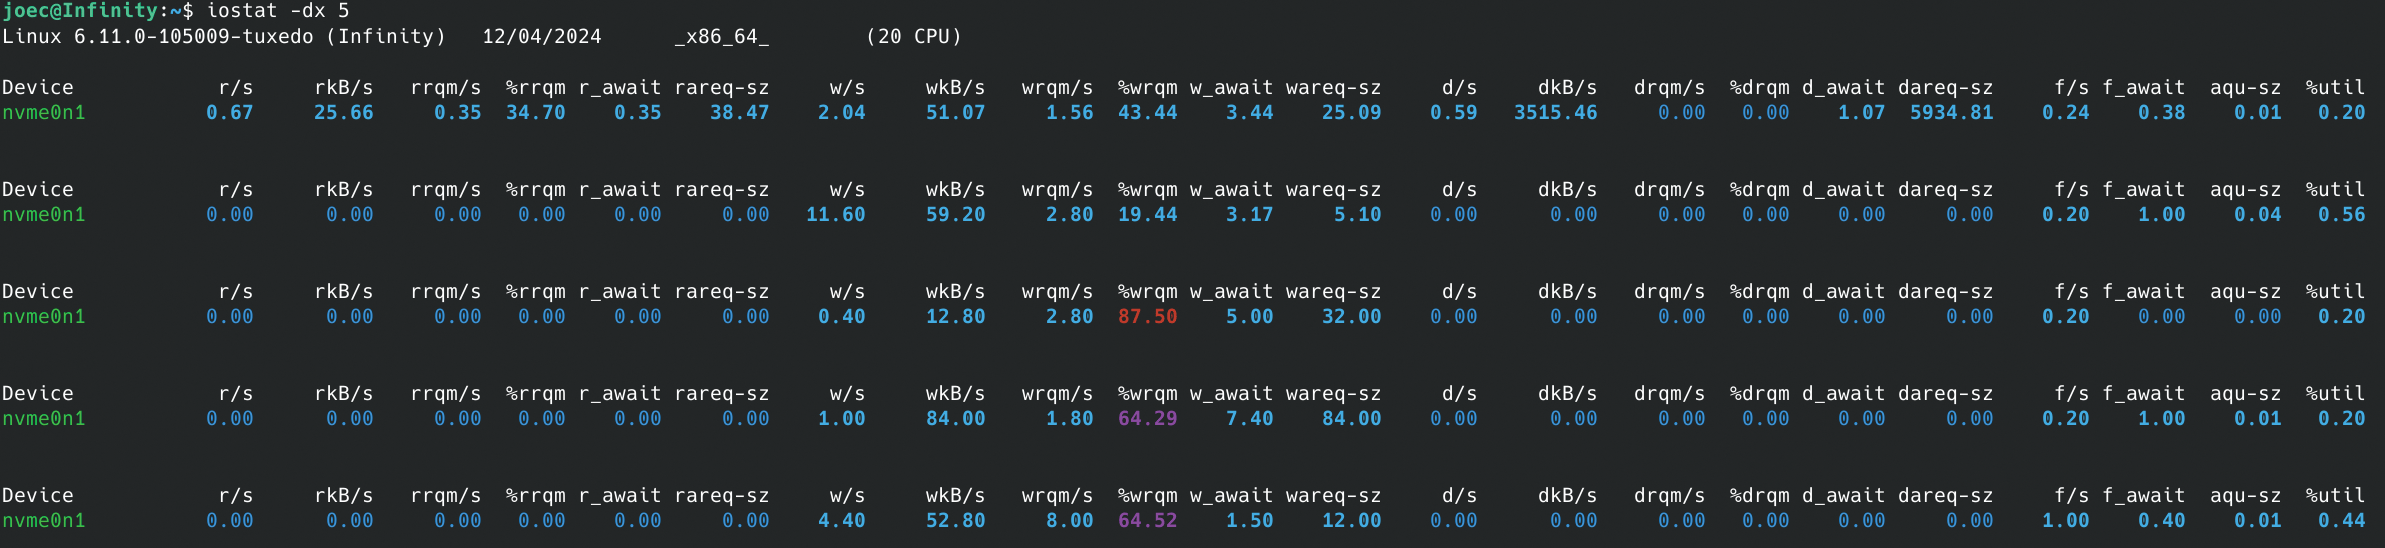
If await is significantly higher than svctm, it indicates that your disks are being overwhelmed with requests, leading to high latency. Based on this diagnosis, you could take several actions, such as tuning your I/O scheduler, switching to faster storage (e.g., SSDs), or increasing disk bandwidth in a cloud environment.
High disk or network latency can cripple high-performance systems. If disk I/O becomes a bottleneck, switching to a faster I/O scheduler (such as noop or deadline) or using direct I/O can yield substantial improvements. For network-bound workloads, increasing the TCP window size (tcp_rmem and tcp_wmem) and tuning kernel parameters for low-latency connections can enhance throughput.
Networking Stack Optimization
The performance of Linux systems is heavily dependent on the efficiency of the networking stack, particularly in environments where applications require high throughput, low latency, or both. Whether you’re managing a web server handling thousands of concurrent connections or a data center with high-bandwidth applications, optimizing the Linux kernel’s networking parameters is crucial. I will take a look at how to tune essential TCP/IP parameters for maximum performance, reduce latency, and configure systems for high-bandwidth, NUMA-aware environments.
Linux TCP/IP stack performance depends on several key parameters that control how the kernel handles connections, buffers, and socket behavior. Properly tuning these parameters can significantly enhance throughput and reduce latency, especially in high-demand environments such as cloud infrastructures or high-concurrency web applications.
One critical parameter for web servers or services that handle numerous concurrent connections is tcp_max_syn_backlog. This setting controls the maximum number of pending TCP connection requests (SYN packets) that can be queued before the system starts dropping packets. As you can imagine, this setting is especially important for servers under heavy load, such as high-traffic websites or API gateways. You can increase the maximum SYN backlog with tcp_max_syn_backlog. The following command allows the system to manage a higher volume of pending TCP connections, which is crucial for handling high traffic without dropping connections:
sudo sysctl -w net.ipv4.tcp_max_syn_backlog=4096
The default value for tcp_max_syn_backlog might be too low (often around 128 or 256) for high-concurrency servers. Increasing this value to 4096 (or higher, depending on the load) allows your server to handle more incoming SYN packets before dropping connections, improving the system’s ability to manage bursts of connection requests.
You can persist this configuration by adding it to /etc/sysctl.conf:
echo "net.ipv4.tcp_max_syn_backlog=4096" | sudo tee -a /etc/sysctl.confsudo sysctl -p
Adjusting tcp_rmem and tcp_wmem
tcp_rmem and tcp_wmemLinux uses dynamic memory buffers for sending and receiving data over TCP connections. The tcp_rmem and tcp_wmem parameters control the minimum, default, and maximum buffer sizes for receiving and transmitting data. In environments where network latency or bandwidth varies, tuning these buffers can prevent performance bottlenecks caused by inefficient buffer management:
sudo sysctl -w net.ipv4.tcp_rmem="4096 87380 6291456"
This command sets the buffer sizes for receiving and sending data, accommodating high-volume data transfers effectively. In this example:
- The first number (4096) sets the minimum buffer size.
- The second (87380 for tcp_rmem and 65536 for tcp_wmem) is the default size.
- The third (6291456) sets the maximum size.
For high-bandwidth environments, increasing the maximum buffer sizes allows TCP to utilize more memory for efficient data transfer, especially for large file transfers or streaming workloads. Setting an appropriate default size ensures that smaller, less bandwidth-intensive connections are not wastefully allocated large buffers, preserving system memory for critical connections.
You can persist these changes by updating /etc/sysctl.conf:
echo "net.ipv4.tcp_rmem =   4096 87380 6291456" | sudo tee -a /etc/sysctl.confecho
"net.ipv4.tcp_wmem =   4096 65536 6291456" | sudo tee -a /etc/sysctl.confsudo sysctl -p
These adjustments ensure that the kernel allocates sufficient buffer space for high-throughput applications, preventing bottlenecks caused by buffer exhaustion.
Tuning Kernel Parameters for Reducing Latency
In latency-sensitive applications such as financial trading platforms, real-time video streaming, or multiplayer gaming, reducing network latency is critical. By tuning kernel parameters related to congestion control and buffer management, you can minimize delays and achieve lower round-trip times (RTT).
TCP congestion control algorithms play a key role in managing packet loss and adjusting the transmission rate to avoid overwhelming network paths. The default algorithm on most Linux systems is cubic, which is optimized for high-bandwidth scenarios but might not always be the best choice for latency-sensitive applications.
BBR (Bottleneck Bandwidth and Round-trip propagation time) is a modern congestion control algorithm designed to minimize network latency by controlling the congestion window size based on estimated bottleneck bandwidth and RTT, rather than packet loss:
sudo sysctl -w net.ipv4.tcp_congestion_control=bbr
This command sets the TCP congestion control parameter to bbr, which helps in enhancing network throughput and reducing latency by adjusting the congestion control method. Verify which congestion control algorithm is currently in use with
sysctl net.ipv4.tcp_congestion_control
For users managing latency-sensitive workloads, switching to BBR or Reno can yield substantial latency reductions by ensuring more consistent throughput with fewer retransmissions. Persist the setting by adding the following line to /etc/sysctl.conf:
echo "net.ipv4.tcp_congestion_control=bbr" | sudo tee -a /etc/sysctl.confsudo sysctl -p
This command ensures the setting remains active after a reboot, supporting improved connection handling under load by appending the configuration and reloading with sysctl -p. In practice, this change can reduce latency in environments with fluctuating network conditions, such as mobile networks or geographically distributed systems.
Tuning Buffer Management to Reduce Jitter
Buffer management is another aspect of reducing network latency. Large buffers can introduce latency variability (also known as jitter), which is detrimental to real-time applications. Linux provides parameters to limit buffer sizes and reduce the impact of excessive buffering, commonly known as bufferbloat. You can configure the maximum receive buffer memory for the network core using rmem_max:
sudo sysctl -w net.core.rmem_max=262144
This command sets a larger buffer size for incoming data, allowing the system to handle higher throughput effectively. By capping the maximum buffer size, you can prevent over-buffering, which reduces jitter and helps stabilize network latency. Additionally, adjusting the receive and send buffer settings for individual connections ensures that TCP doesn’t introduce unnecessary delays in packet transmission.
These adjustments, while seemingly minor, can dramatically improve performance in environments where predictability and consistency are more important than raw bandwidth. For example, multiplayer gaming servers and real-time financial applications rely on minimal jitter to maintain a smooth and predictable user experience.
NUMA-Aware Network Tuning
In high-performance computing (HPC) and data centers, Non-Uniform Memory Access (NUMA) systems introduce complexities in optimizing network performance. NUMA systems distribute memory access across multiple nodes, and networking performance can suffer when memory and network interface cards (NICs) are misaligned between NUMA nodes. Optimizing NUMA awareness in network configurations is crucial for maintaining high throughput and low latency in these environments.
In a NUMA system, ensuring that NICs are assigned to the correct CPU cores is essential for reducing cross-node memory access delays. You can achieve this by binding NIC interrupts and network processing to CPUs that are local to the NIC’s NUMA node, minimizing the overhead of accessing memory across NUMA boundaries:
sudo echo 1 > /proc/irq/<IRQ_NUMBER>/smp_affinity
Here, <IRQ_NUMBER> corresponds to the IRQ number of the NIC. Setting the affinity to 1 ensures that the interrupt is handled by the first CPU on the NIC’s NUMA node. For high-throughput networking, you might spread interrupts across multiple CPUs on the same NUMA node to parallelize packet processing.
To automate this process across system reboots, consider using the irqbalance service, which dynamically assigns interrupt handling across CPUs based on load. However, for latency-sensitive environments, manual tuning often yields better results.
Receive Side Scaling (RSS) allows for the parallel processing of network traffic across multiple CPUs, distributing the load more evenly. In NUMA systems, ensuring that RSS is NUMA-aware can help further optimize performance:
ethtool -L eth0 combined 8
This command instructs the system to use 8 RX/TX queues on the network interface eth0, allowing traffic to be distributed across eight cores. By ensuring these cores are located on the same NUMA node as the NIC, you can minimize memory access latency and maximize network throughput.
Frequently Asked Questions
1. What are the best tools for Linux performance profiling and monitoring?
The most effective Linux performance tools include:
- perf: Comprehensive CPU, memory, and I/O profiling with call graph analysis
- ftrace: Low-level kernel function tracing for debugging system calls and kernel operations
- bpftrace: Programmable tracing for custom metrics and real-time system analysis
- iostat: Disk I/O performance monitoring and bottleneck identification
- valgrind/massif: Memory profiling and leak detection for applications
- htop/top: Real-time system resource monitoring
- vmstat: Virtual memory and system activity statistics
2. How do I optimize Linux TCP performance for high-throughput applications?
Optimize TCP performance by tuning these key parameters. Remember to apply these changes with sudo sysctl -w <parameter>=<value> and make them permanent by adding the lines to /etc/sysctl.conf, then running sudo sysctl -p or use the following commands.
-
tcp_max_syn_backlog: Increase this value to4096or higher to handle more incoming connection requests simultaneously, preventing dropped connections under heavy load.echo "net.ipv4.tcp_max_syn_backlog=4096" | sudo tee -a /etc/sysctl.conf sudo sysctl -p -
tcp_rmem/tcp_wmem: Set buffer sizes for receiving (rmem) and sending (wmem) data. The format ismin default max. For example,"4096 87380 6291456"allows for efficient data transfer, especially over high-bandwidth, high-latency links.sudo sysctl -w net.ipv4.tcp_rmem="4096 87380 6291456" sudo sysctl -w net.ipv4.tcp_wmem="4096 87380 6291456" -
tcp_congestion_control: Switch to an algorithm like BBR (Bottleneck Bandwidth and RTT) for better latency and throughput, especially in environments with packet loss or varying network conditions.echo "net.ipv4.tcp_congestion_control=bbr" | sudo tee -a /etc/sysctl.conf sudo sysctl -p -
net.core.rmem_max: Increase the maximum size of the receive buffer for all network sockets. This is crucial for high-bandwidth scenarios to prevent data loss and improve throughput.echo "net.core.rmem_max=6291456" | sudo tee -a /etc/sysctl.conf sudo sysctl -p -
tcp_window_scaling: Ensure this is enabled (1) to allow TCP to use larger window sizes, which is essential for maximizing throughput over high-latency or high-bandwidth connections.sudo sysctl -w net.ipv4.tcp_window_scaling=1echo "net.ipv4.tcp_window_scaling=1" | sudo tee -a /etc/sysctl.conf sudo sysctl -p
Apply changes with sysctl -w and persist in /etc/sysctl.conf.
3. What is NUMA tuning and why is it important for performance?
NUMA (Non-Uniform Memory Access) tuning optimizes memory access in multi-socket systems by:
- Binding processes to specific NUMA nodes to minimize cross-node memory access
- Aligning network interfaces with local CPU cores using IRQ affinity
- Configuring Receive Side Scaling (RSS) to distribute network processing across local cores
- Using numactl to control memory allocation policies
NUMA tuning is crucial for high-performance computing, databases, and latency-sensitive applications where memory access patterns significantly impact performance.
4. How can I identify and fix memory performance issues in Linux?
Use these approaches to diagnose and resolve memory problems:
- Monitor with valgrind/massif: Track memory allocation patterns and identify leaks
- Use bpftrace: Trace kernel memory allocations in real-time
- Check /proc/meminfo: Monitor memory usage, swap, and fragmentation
- Adjust vm.swappiness: Reduce swapping (set to 1-10) for better performance
- Enable Transparent Huge Pages (THP): Improve memory allocation efficiency
- Monitor OOM killer logs: Identify processes consuming excessive memory
5. What kernel parameters should I tune for low-latency applications?
For latency-sensitive applications, focus on these parameters:
- tcp_congestion_control=bbr: Better latency than default cubic algorithm
- net.core.rmem_max: Limit buffer sizes to reduce jitter
- kernel.sched_rt_runtime_us: Adjust real-time scheduling
- kernel.timer_migration: Disable for consistent timer behavior
- irqbalance: Disable and manually set IRQ affinity
- CPU frequency scaling: Set to performance mode
- Transparent Huge Pages: May need disabling for consistent latency
Conclusion
Optimizing the Linux networking stack is essential for achieving high performance in demanding environments such as high-concurrency servers, low-latency applications, and high-bandwidth data centers. This article covered some important optimization techniques, including tuning TCP/IP parameters such as tcp_max_syn_backlog for handling large volumes of connections and adjusting tcp_rmem and tcp_wmem for efficient buffer management. I also explored advanced congestion control algorithms such as BBR for reducing latency and how proper buffer management prevents jitter. In NUMA-aware systems, aligning NICs to the correct CPU cores and leveraging Receive Side Scaling optimizes network throughput.
Beyond networking are numerous other techniques for optimizing Linux performance, such as CPU scheduling optimization, memory management tuning, interrupt handling, and affinity tuning, all of which target specific system bottlenecks. These strategies, when applied correctly, help ensure that Linux environments perform optimally and scale to meet demanding workloads.
This content is based on an article from Linux Magazine and is available to you through a collaboration with DigitalOcean.
Thanks for learning with the DigitalOcean Community. Check out our offerings for compute, storage, networking, and managed databases.
About the author
Marcin Gastol is a senior DevOps engineer and Microsoft Certified Trainer with extensive experience in Azure technologies and teaching various IT subjects. He writes about multiple IT topics on his blog, https://marcingastol.com/.
Still looking for an answer?
This textbox defaults to using Markdown to format your answer.
You can type !ref in this text area to quickly search our full set of tutorials, documentation & marketplace offerings and insert the link!
 This work is licensed under a Creative Commons Attribution-NonCommercial- ShareAlike 4.0 International License.
Become a contributor for community
Get paid to write technical tutorials and select a tech-focused charity to receive a matching donation.

DigitalOcean Documentation
Full documentation for every DigitalOcean product.

Resources for startups and AI-native businesses
The Wave has everything you need to know about building a business, from raising funding to marketing your product.
The developer cloud
Scale up as you grow — whether you're running one virtual machine or ten thousand.

Start building today
From GPU-powered inference and Kubernetes to managed databases and storage, get everything you need to build, scale, and deploy intelligent applications.
