
Introduction
As web sites and web applications get more feature-rich and complex, performance becomes a major concern for developers and users alike. With studies showing that faster sites result in more engaged users, more sales, and increased traffic, it’s important to pay attention to how quickly you can deliver your site to your users and get it rendered in their browser.
The general term for this area of knowledge is web performance optimization, and over the past few years many best practices, techniques, and technologies have been developed to improve the web experience. Many of these techniques focus on reducing the download size of web pages, optimizing JavaScript, and limiting the number of individual HTTP requests a page needs.
In this article, we’ll talk about the other side of web performance: how fast can your server respond to your user’s requests? We’ll review the general landscape of load testing, step through a plan to find your server’s maximum practical response rate, and discuss some open-source load testing software.
Glossary
Before we begin, let’s clarify some relevant terms and concepts:
-
Latency is a measure of how fast a server responds to requests from the client. Typically measured in milliseconds (ms), latency is often referred to as response time. Lower numbers indicate faster responses. Latency is measured on the client side, from the time the request is sent until the response is received. Network overhead is included in this number.
-
Throughput is how many requests the server can handle during a specific time interval, usually reported as requests per second.
-
Percentiles are a way of grouping results by their percentage of the whole sample set. If your 50th percentile response time is 100ms, that means 50% of the requests were returned in 100ms or less. The graph below shows why it’s useful to look at your measurements by percentile:
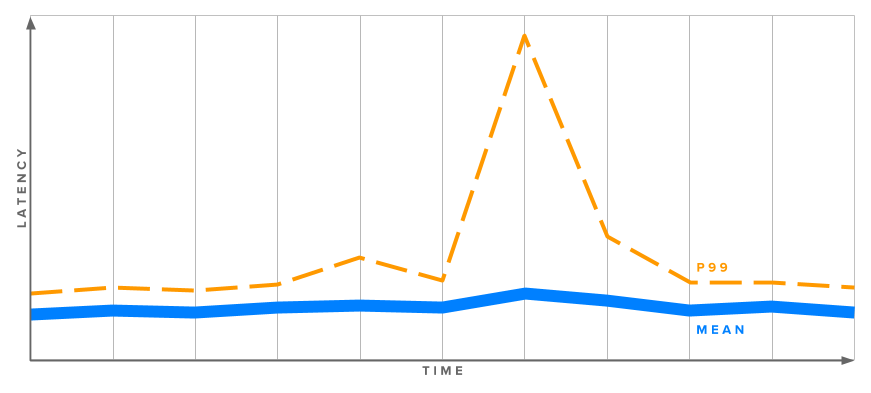
The graph above shows the latency of a web server over a period of time. Even though the mean (average) response time is fairly consistent, there’s a large spike in the 99th percentile line. This means that 1% of our users’ requests performed even worse than this 99th percentile measurement, while the average remained relatively stable. For this reason, it’s worth looking at percentiles to get a more accurate feel for what your users are really experiencing.
Load Testing Basics
Load testing is the practice of sending simulated HTTP traffic to a server in order to measure performance and answer some important questions, such as:
- Does the server have enough resources (CPU, memory, etc.) to handle the anticipated load?
- Does the server respond quickly enough to provide a good user experience?
- Is our application running efficiently?
- Do we need to scale up our server hardware, or scale out to multiple servers?
- Are there any pages or API calls that are particularly resource intensive?
Load testing is performed by running load testing software on one machine (or a cluster of machines) to generate a large amount of requests to a web server on a second machine (or other more complex web serving infrastructure). There are many such tools available, and we’ll look at some specific software later on. For now, we’ll discuss load testing in terms that will be relevant no matter what software you choose.
A common use of load testing software is to find the maximum requests per second that a server can handle. This is done by sending as many requests as possible to a server and seeing how many it can return successfully.
This is useful as a first step to understanding your server’s maximum capacity, but it doesn’t give us much information about latency and the actual day-to-day performance that your users will experience. A heavily loaded server may be able to return a thousand responses per second, but if each response takes ten seconds, your users will likely be unhappy.
The graph below shows a view of the relationship between throughput (responses per second) and latency:
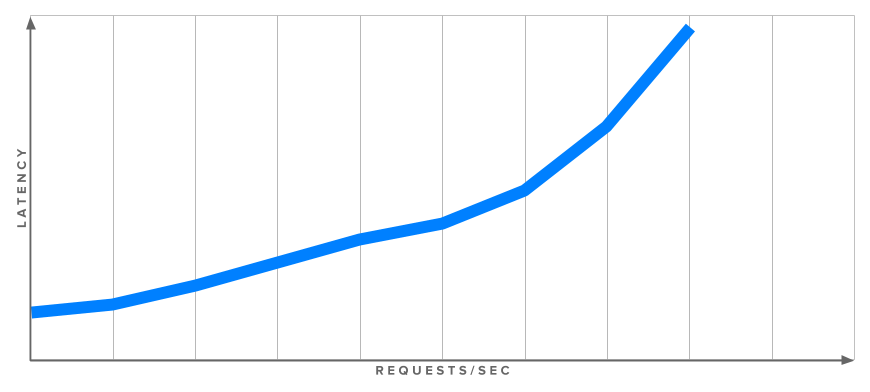
This is just an example, and every setup will have a unique response profile, but the general trend is that higher load (more requests per second) results in higher latency. To get a more real-world idea of our server’s latency at a given load, we’ll need to test multiple times at different request rates. Not all load testing software is capable of this, but later on we’ll discuss wrk2, a command line load testing tool that can perform this function.
What is a reasonable latency target?
Though website load times in the 2–5 second range are common, the portion of that time attributed to web server latency is typically around 50–200 milliseconds. What is right for you and your site depends on too many factors (your audience, market, purpose of the site, is the site user-facing or an API service, etc.) to give a more concrete target number, but keep in mind most studies show that every little bit of speed counts, and even “imperceptible” improvements lead to better results when viewed in the aggregate.
Now that we have a general understanding of load testing, let’s discuss a specific plan to explore the performance of our server.
A Load Testing Plan
There are a few general steps you can take to get a feel for how your server and web application are performing and responding to load. First, we’re going to make sure we’re monitoring the right system resources during the load test. Then, we’ll find out the absolute maximum requests per second our server is capable of. Finally, we’ll find the maximum throughput at which our server’s latency would result in unacceptable performance for our users.
Step 1 — Monitoring Resources
Our load testing software will give us information about requests and latency, but it’s useful to monitor some other system metrics to see if the server becomes resource constrained when dealing with high traffic volumes.
We’re mostly concerned with CPU load and free memory: watching these while under heavy load will help you make more informed decisions about how to scale infrastructure and where to focus efforts when developing your application.
If you’ve already set up a monitoring system (such as Prometheus or Graphite and CollectD) you’re all set. If not, log in to your web server via SSH and use the following command line tools to monitor in real-time.
To check on available memory, you can use the free command. Combine it with watch to periodically (every two seconds by default) update the output:
- watch free -h
The -h flag tells free to output the numbers in a human readable format instead of bytes:
Output             total       used       free     shared    buffers     cached
Mem:          489M       261M       228M       352K       7.5M       213M
-/+ buffers/cache:        39M       450M
Swap:           0B         0B         0B
The highlighted number in the output above represents free memory after subtracting buffer and cache usage. Newer versions of of free have changed the output:
Output              total        used        free      shared  buff/cache   available
Mem:           488M        182M         34M         14M        271M        260M
Swap:            0B          0B          0B
The new available column is calculated slightly differently, but generally represents the same metric: memory currently available for applications to use.
For monitoring CPU usage from the command line, mpstat is a good utility that gives an updating view of the amount of idle CPU resources. mpstat is not installed by default on Ubuntu. You can install it with the following command:
- sudo apt-get install sysstat
When you launch mpstat you need to tell it the number of seconds you’d like between updates:
- mpstat 2
This will output a header row, then a row of stats every two seconds:
OutputLinux 4.4.0-66-generic (example-server) 	08/21/2017 	_x86_64_	(4 CPU)

08:06:26 PM  CPU    %usr   %nice    %sys %iowait    %irq   %soft  %steal  %guest  %gnice   %idle
08:06:28 PM  all    0.00    0.00    0.00    0.00    0.00    0.00    0.00    0.00    0.00  100.00
08:06:30 PM  all    0.00    0.00    0.00    0.00    0.00    0.00    0.00    0.00    0.00  100.00
%idle shows us the percentage of CPU resources not being used. The reason we look at how much is idle instead of how much is used is because CPU utilization is often split up into different categories such as user CPU and system CPU. Instead of adding these up on the fly, we look at the idle side of the equation.
Now that we can observe our server’s resources, let’s run an initial load test to find our server’s maximum response rate.
Step 2 — Finding the Maximum Response Rate
As mentioned previously, most load testing software is particularly well suited for finding the maximum response rate of your web server. Often, the only options you’ll need to set are the desired concurrency and the duration of the test.
Concurrency is a measure of how many parallel connections are made to the server. 100 is a safe default choice for this, but you can make a more informed choice by checking your web server’s MaxClients, MaxThreads, or similar settings to determine how many simultaneous connections it can handle.
In addition to setting those options, you’ll need to pick a URL to use for the test. If your software can only handle one URL at a time, it’s worthwhile to do multiple tests with a few different URLs, as the processing requirements may vary greatly between – for instance – your home page and a product page that requires multiple database queries to load.
Alternately, some load testing software lets you specify multiple URLs to test at once. This is a good way to more accurately simulate real world traffic. If you have existing site usage data (from analytics software, or server logs), you can closely match your test URLs to observed values.
When you’ve sorted out the URL or URLs to test, run the load test. Make sure your software is sending requests as rapidly as possible. If you’re using software that requires you to choose the request rate, choose a value that’s almost certain to be too large. If your software has a configurable delay between requests, reduce it to zero.
You should see your CPU and memory resources being consumed. Your CPU idle might reach 0% and your load testing client may receive some connection errors as your server struggles to keep up with all the requests. This is normal, as we’re pushing the server to its limits.
When it’s all over, your software will output some statistics, including requests per second. Note the response time as well: it’s likely to be very poor, as the server should have been extremely overextended. Because of this, the requests per second number is not a good indicator of the real-world maximum throughput for your server, but it’s a good starting point for further exploration.
Next, we’ll dial back the load and test again to get more information on how our server performs when it’s not pushed to its absolute limit.
Step 3 — Find the Maximum Practical Throughput
For this step, we need to use load testing software that can back off the load a bit to test our server’s performance at varying levels of throughput. Some software does this by allowing you to specify a delay between each request, but this makes it difficult to target a precise throughput.
Fortunately, wrk2 allows you to specify an exact requests per second target. It does this by first running some calibration requests to get its timing just right.
Take your maximum request rate from the previous step and cut it in half. Run another test at this new rate and note the response time. Is it still in the acceptable range?
If yes, walk the rate back up towards the maximum, testing as you go until your latency is at the maximum value you’ve determined to be acceptable. This is the actual maximum response rate your server can handle before your users will experience degraded performance.
Note: As was mentioned in the glossary, when measuring latency you should be looking at something like the 99th or even the 99.999th percentile to ensure that all of your users are regularly experiencing response times that are under your maximum acceptable threshold. Remember that most web pages require dozens of requests to fetch all assets (including images, JavaScript, CSS files, etc.) and render the page. If your web page takes ten requests to complete, and you’re measuring the 99th percentile, roughly 10% of your page loads will still experience one request with higher latency.
Next, we’ll look at some open-source software packages available to help us implement our load testing plan.
Load Testing Software
There are many open source software packages available for load testing. In addition, there are many commercial services that will run load testing infrastructure for you and automatically create graphs and reports from the test data. These services could be a good choice for businesses that need to generate a large amount of load to test large-scale infrastructure, as most of them run clusters of machines to generate many more requests than a single server could.
That said, some of the open source tools are also capable of running in a cluster mode. Let’s walk through a few of the more popular open source tools and summarize their features:
ab
ab (also known as ApacheBench) is a simple, single-threaded command line tool for benchmarking an HTTP server. Though it was originally distributed as part of the Apache HTTP Server, you may use ab to test any HTTP or HTTPS server.
Because it is single-threaded, ab can’t take advantage of multiple processors to send a great volume of requests. This can be limiting if you’re trying to completely load a powerful web server.
A basic invocation of the ab command looks like this:
- ab -n 1000 -c 100 http://example.com/
You specify the number of requests (-n) and the concurrency (-c) and then give it a single URL to fetch. The output — excerpted below — contains requests per second, request time, and a listing of different response time percentiles:
Output. . .
Requests per second:    734.76 [#/sec] (mean)
Time per request:       136.098 [ms] (mean)
Time per request:       1.361 [ms] (mean, across all concurrent requests)
Transfer rate:          60645.11 [Kbytes/sec] received

Percentage of the requests served within a certain time (ms)
  50%    133
  66%    135
  75%    137
  80%    139
  90%    145
  95%    149
  98%    150
  99%    151
 100%    189 (longest request)
JMeter
JMeter is a powerful and feature-rich load testing and functional testing app from the Apache Software Foundation. Functional testing means that JMeter can also test to make sure your website or application is producing the correct output.
JMeter has a Java GUI for setting up Test Plans:
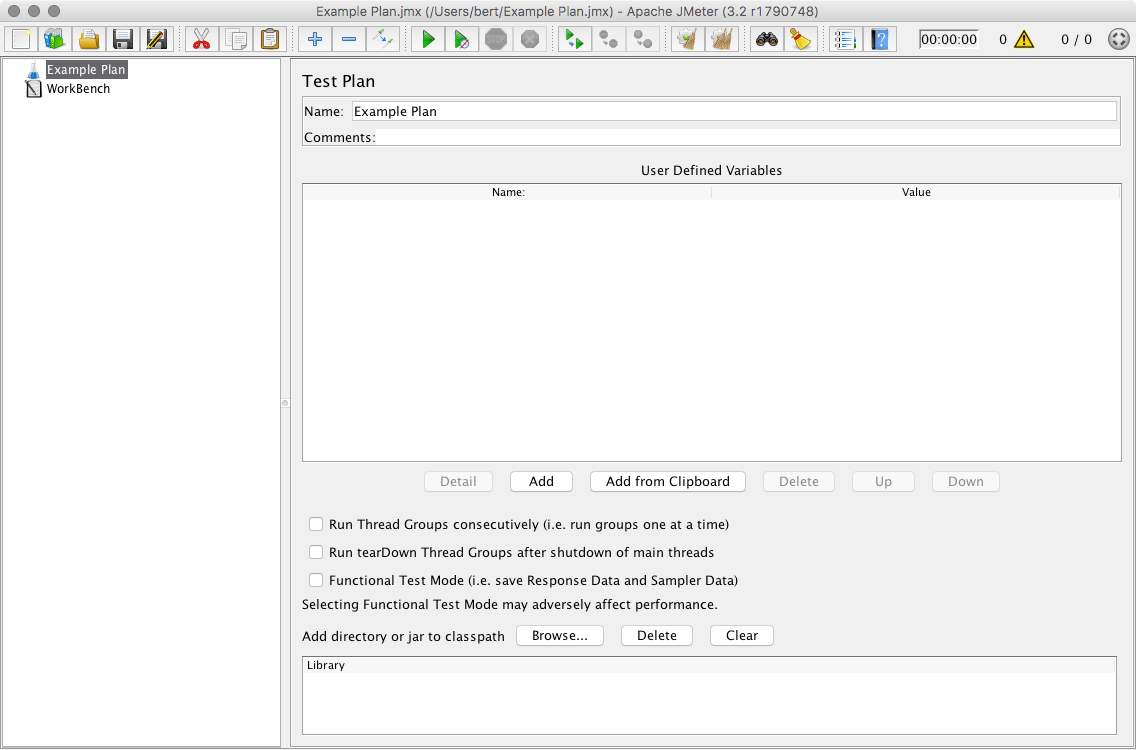
Test plans can be recorded by using JMeter’s traffic recording web proxy and a normal browser. This allows you to test with traffic that more closely simulates real-world use.
JMeter can output percentile information in HTML reports and other formats.
Siege
Siege is another command line load testing tool, similar to ab but with a few different features. Siege is multithreaded, enabling relatively high throughput. It also allows you to provide a list of multiple URLs to be load tested. A basic invocation follows:
- siege -c 100 -t 30s http://example.com/
This calls for 100 concurrent requests (-c 100) and a thirty second test (-t 30s). Siege outputs the average response time and the request rate:
Output. . .
Transactions:		        5810 hits
Availability:		      100.00 %
Elapsed time:		       29.47 secs
Data transferred:	      135.13 MB
Response time:		       0.01 secs
Transaction rate:	     197.15 trans/sec
Throughput:		        4.59 MB/sec
Concurrency:		        2.23
. . .
Siege provides no percentile breakdown for its latency statistics.
Locust
Locust is a Python-based load testing tool with a real-time web UI for monitoring results:
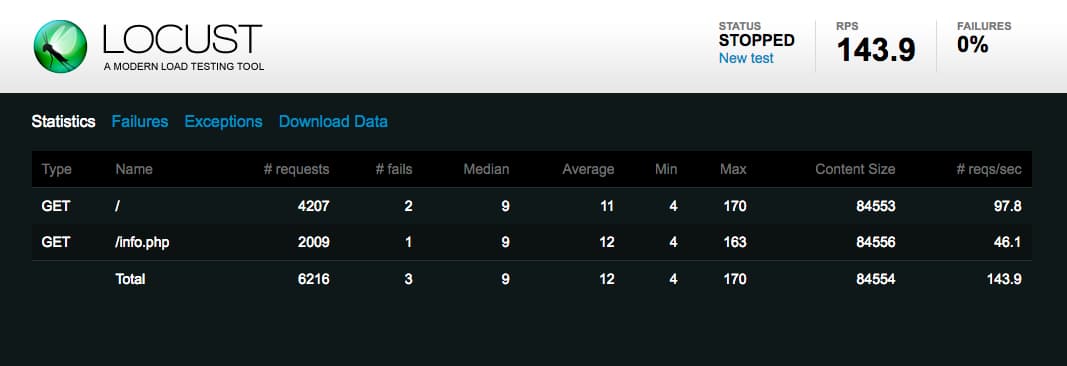
You write Locust test scenarios in Python code, allowing for some powerful configuration that’s convenient for those already familiar with the language.
Locust can also be run in distributed mode, where you can run a cluster of Locust servers and have them produce load in a coordinated fashion. This facilitates the load testing of powerful web serving infrastructure.
Locust can provide detailed statistics and percentile information in downloadable CSV files.
wrk2
wrk2 is a multi-threaded command line load testing tool that’s capable of producing load at a specified requests rate. It can provide detailed latency statistics and is scriptable with the Lua programming language.
wrk2 is invoked with the wrk command (it is a fork of the original wrk):
- wrk -t4 -c100 -d30s -R100 --latency http://example.com/
The above options specify four threads (-t4, you should use the number of processor cores on your machine), 100 concurrent requests (-c100), a thirty second test period (-d30s), and a request rate of 100 requests per second (-R100). Finally, we request detailed latency output with --latency:
Output. . .
Latency Distribution (HdrHistogram - Recorded Latency)
50.000%    5.79ms
75.000%    7.58ms
90.000%   10.19ms
99.000%   29.30ms
99.900%   30.69ms
99.990%   31.36ms
99.999%   31.36ms
100.000%   31.36ms
. . .
The above output is an excerpt – more detailed latency percentiles are also printed.
Conclusion
In this article, we reviewed some load testing terminology and basic concepts, walked through a plan to find our maximum practical requests per second, observed system resources to guide future decisions about hardware and development efforts, and looked at some of the available open-source load testing software.
After measuring the performance of your infrastructure, you may want to act on this information to try to improve response times and reduce server load. You may want to scale your web server hardware up, or out with multiple servers and a load balancer. You might try to fine-tune your web server configuration to optimize the number of connections it allows or the number of worker processes or threads it uses. You could also look into caching frequently accessed data in memory, to reduce database load and query time.
You’ll find the above topics and more at our collection of Server Optimization tagged tutorials.
Thanks for learning with the DigitalOcean Community. Check out our offerings for compute, storage, networking, and managed databases.
About the author
Senior Technical Writer at DigitalOcean
Still looking for an answer?
This textbox defaults to using Markdown to format your answer.
You can type !ref in this text area to quickly search our full set of tutorials, documentation & marketplace offerings and insert the link!
Hi Brian nice article and run down of options. All the above testers only test HTTP/1.1 based HTTP and HTTPS. You forgot to include the only HTTP/2 HTTPS based load tester that I know of, nghttp2’s h2load https://nghttp2.org/documentation/h2load-howto.html
Example of h2load tester in action https://community.centminmod.com/threads/caddy-http-2-server-benchmarks-part-2.12873/ :)
 This work is licensed under a Creative Commons Attribution-NonCommercial- ShareAlike 4.0 International License.
Become a contributor for community
Get paid to write technical tutorials and select a tech-focused charity to receive a matching donation.

DigitalOcean Documentation
Full documentation for every DigitalOcean product.

Resources for startups and AI-native businesses
The Wave has everything you need to know about building a business, from raising funding to marketing your product.
The developer cloud
Scale up as you grow — whether you're running one virtual machine or ten thousand.

Start building today
From GPU-powered inference and Kubernetes to managed databases and storage, get everything you need to build, scale, and deploy intelligent applications.
