
Introduction
We’re finally ready to set up centralized logging for our production application setup. Centralized logging is a great way to gather and visualize the logs of your servers. Generally, setting up an elaborate logging system is not as important as having solid backups and monitoring set up, but it can be very useful when trying to identify trends or problems with your application.
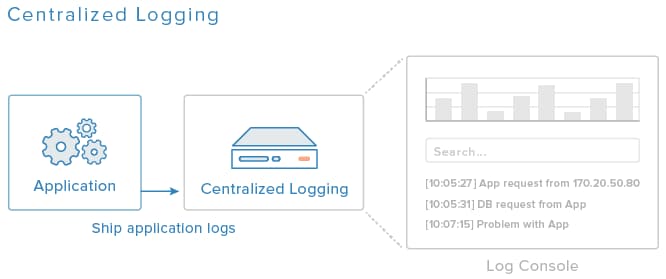
In this tutorial, we will set up an ELK stack (Elasticsearch, Logstash, and Kibana), and configure the servers that comprise our application to send their relevant logs to the logging server. We will also set up Logstash filters that will parse and structure our logs which will allow us to easily search and filter them, and use them in Kibana visualizations.
Prerequisites
If you want to access your logging dashboard via a domain name, create an A Record under your domain, like “logging.example.com”, that points to your logging server’s public IP address. Alternatively, you can access the monitoring dashboard via the public IP address. It is advisable that you set up the logging web server to use HTTPS, and limit access to it by placing it behind a VPN.
Install ELK on Logging Server
Set up ELK on your logging server by following this tutorial: How To Install Elasticsearch, Logstash, and Kibana 4 on Ubuntu 14.04.
If you are using a private DNS for name resolution, be sure to follow Option 2 in the Generate SSL Certificates section.
Stop when you reach the Set Up Logstash Forwarder section.
Set Up Logstash Forwarder on Clients
Set up Logstash Forwarder, a log shipper, on your client servers, i.e. db1, app1, app2, and lb1, by following the Set Up Logstash Forwarder section, of the ELK tutorial.
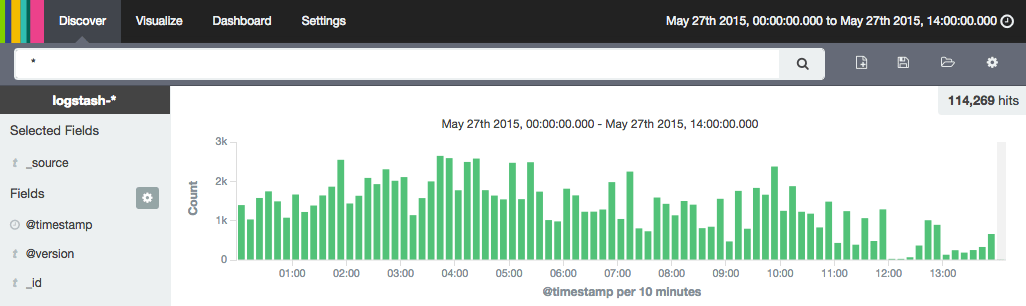
When you are finished, you should be able to log into Kibana via the logging server’s public network address, and view the syslogs of each of your servers.
Identify Logs to Collect
Depending on your exact application and setup, different logs will be available to be collected into your ELK stack. In our case, we will collect the following logs:
- MySQL slow query logs (db1)
- Apache access and error logs (app1 and app2)
- HAProxy logs (lb1)
We chose these logs because they can provide some useful information when troubleshooting or trying to identify trends. Your servers may have other logs that you want to gather, but this will help you get started.
Set Up MySQL Logs
MySQL’s slow query log is typically located at /var/log/mysql/mysql-slow. It consists of logs that take run long enough to be considered “slow queries”, so identifying these queries can help you optimize or troubleshoot your application.
Enable MySQL Slow Query Log
The slow query log isn’t enabled by default, so let’s configure MySQL to log these types of queries.
Open your MySQL configuration file:
- sudo vi /etc/mysql/my.cnf
Find the commented “log_slow_queries” line, and uncomment it so it looks like this:
log_slow_queries = /var/log/mysql/mysql-slow.log
Save and exit.
We need to restart MySQL to put the change into effect:
- sudo service mysql restart
Now MySQL will log its long running queries to the log file specified in the configuration.
Ship MySQL Log Files
We must configure Logstash Forwarder to ship the MySQL slow query log to our logging server.
On your database server, db1, open the Logstash Forwarder configuration file:
- sudo vi /etc/logstash-forwarder.conf
Add the following, in the “files” section under the existing entries, to send the MySQL slow query logs as type “mysql-slow” to your Logstash server:
,
    {
      "paths": [
        "/var/log/mysql/mysql-slow.log"
       ],
      "fields": { "type": "mysql-slow" }
    }
Save and exit. This configures Logstash Forwarder to ship the MySQL slow query logs and mark them “mysql-slow” type logs, which will be used for filtering later.
Restart Logstash Forwarder to start shipping the logs:
- sudo service logstash-forwarder restart
Multiline Input Codec
The MySQL slow query log is in a multiline format (i.e. each entry spans multiple lines), so we must enable Logstash’s multiline codec to be able to process this type of log.
On the ELK server, logging, open the configuration file where your Lumberjack input is defined:
- sudo vi /etc/logstash/conf.d/01-lumberjack-input.conf
Within the lumberjack input definition, add these lines:
    codec => multiline {
      pattern => "^# User@Host:"
      negate => true
      what => previous
    }
Save and exit. This configures Logstash to use the multiline log processor when it encounters logs that contain the specified pattern (i.e. starts with “# User@Host:”).
Next, we will set up the Logstash filter for the MySQL logs.
MySQL Log Filter
On the ELK server, logging, open a new file to add our MySQL log filters to Logstash. We will name it 11-mysql.conf, so it will be read after the Logstash input configuration (in the 01-lumberjack-input.conf file):
- sudo vi /etc/logstash/conf.d/11-mysql.conf
Add the following filter definition:
filter {
  # Capture user, optional host and optional ip fields
  # sample log file lines:
  if [type] == "mysql-slow" {
    grok {
      match => [ "message", "^# User@Host: %{USER:user}(?:\[[^\]]+\])?\s+@\s+%{HOST:host}?\s+\[%{IP:ip}?\]" ]
    }
    # Capture query time, lock time, rows returned and rows examined
    grok {
      match => [ "message", "^# Query_time: %{NUMBER:duration:float}\s+Lock_time: %{NUMBER:lock_wait:float} Rows_sent: %{NUMBER:results:int} \s*Rows_examined: %{NUMBER:scanned:int}"]
    }
    # Capture the time the query happened
    grok {
      match => [ "message", "^SET timestamp=%{NUMBER:timestamp};" ]
    }
    # Extract the time based on the time of the query and not the time the item got logged
    date {
      match => [ "timestamp", "UNIX" ]
    }
    # Drop the captured timestamp field since it has been moved to the time of the event
    mutate {
      remove_field => "timestamp"
    }
  }
}
Save and exit. This configures Logstash to filter mysql-slow type logs with the Grok patterns specified in the match directives. The apache-access type logs are being parsed by the Logstash-provided Grok pattern that matches the default Apache log message format, while the apache-error type logs are being parsed by a Grok filter that was written to match the default error log format.
To put these filters to work, let’s restart Logstash:
- sudo service logstash restart
At this point, you will want to ensure that Logstash is running properly, as configuration errors will cause it to fail.
You will also want to confirm that Kibana is able to view the filtered Apache logs.
Apache Logs
Apache’s logs are typically located in /var/log/apache2, named “access.log” and “error.log”. Gathering these logs will allow you to look at the IP addresses of who is accessing your servers, what they are requesting, and which OS and web browsers they are using, in addition to any error messages that Apache is reporting.
Ship Apache Log Files
We must configure Logstash Forwarder to ship the Apache access and error logs to our logging server.
On your application servers, app1 and app2, open the Logstash Forwarder configuration file:
- sudo vi /etc/logstash-forwarder.conf
Add the following, in the “files” section under the existing entries, to send the Apache logs, as the appropriate types, to your Logstash server:
,
    {
      "paths": [
        "/var/log/apache2/access.log"
       ],
      "fields": { "type": "apache-access" }
    },
    {
      "paths": [
        "/var/log/apache2/error.log"
       ],
      "fields": { "type": "apache-error" }
    }
Save and exit. This configures Logstash Forwarder to ship the Apache access and error logs and mark them as their respective types, which will be used for filtering the logs.
Restart Logstash Forwarder to start shipping the logs:
sudo service logstash-forwarder restart
Right now, all of your Apache logs will have a client source IP address that matches the HAProxy server’s private IP address, as the HAProxy reverse proxy is the only way to access your application servers from the Internet. To change this to show the source IP of the actual user that is accessing your site, we can modify the default Apache log format to use the X-Forwarded-For headers that HAProxy is sending.
Open your Apache configuration file (apache2.conf):
- sudo vi /etc/apache2/apache2.conf
Find the line that looks like this:
[Label apache2.conf — Original "combined" LogFormat]
LogFormat "%h %l %u %t \"%r\" %>s %O \"%{Referer}i\" \"%{User-Agent}i\"" combined
Replace %h with %{X-Forwarded-For}i, so it looks like this:
[Label apache2.conf — Updated "combined" LogFormat]
LogFormat "%{X-Forwarded-For}i %l %u %t \"%r\" %>s %O \"%{Referer}i\" \"%{User-Agent}i\"" combined
Save and exit. This configures the Apache access log to include the source IP address of your actual users, instead of the HAProxy server’s private IP address.
Restart Apache to put the log change into effect:
- sudo service apache2 restart
Now we’re ready to add Apache log filters to Logstash.
Apache Log Filters
On the ELK server, logging, open a new file to add our Apache log filters to Logstash. We will name it 12-apache.conf, so it will be read after the Logstash input configuration (in the 01-lumberjack-input.conf file):
- sudo vi /etc/logstash/conf.d/12-apache.conf
Add the following filter definitions:
filter {
  if [type] == "apache-access" {
    grok {
      match => { "message" => "%{COMBINEDAPACHELOG}" }
    }
  }
}
filter {
  if [type] == "apache-error" {
    grok {
      match => { "message" => "\[(?<timestamp>%{DAY:day} %{MONTH:month} %{MONTHDAY} %{TIME} %{YEAR})\] \[%{DATA:severity}\] \[pid %{NUMBER:pid}\] \[client %{IPORHOST:clientip}:%{POSINT:clientport}] %{GREEDYDATA:error_message}" }
    }
  }
}
Save and exit. This configures Logstash to filter apache-access and apache-error type logs with the Grok patterns specified in the respective match directives. The apache-access type logs are being parsed by the Logstash-provided Grok pattern that matches the default Apache log message format, while the apache-error type logs are being parsed by a Grok filter that was written to match the default error log format.
To put these filters to work, let’s restart Logstash:
- sudo service logstash restart
At this point, you will want to ensure that Logstash is running properly, as configuration errors will cause it to fail. You will also want to confirm that Kibana is able to view the filtered Apache logs.
HAProxy Logs
HAProxy’s logs are typically located in /var/log/haproxy.log. Gathering these logs will allow you to look at the IP addresses of who is accessing your load balancer, what they are requesting, which application server is serving their requests, and various other details about the connection.
Ship HAProxy Log Files
We must configure Logstash Forwarder to ship the HAProxy logs.
On your HAProxy server, lb1, open the Logstash Forwarder configuration file:
sudo vi /etc/logstash-forwarder.conf
Add the following, in the “files” section under the existing entries, to send the HAProxy logs as type “haproxy-log” to your Logstash server:
,
    {
      "paths": [
        "/var/log/haproxy.log"
       ],
      "fields": { "type": "haproxy-log" }
    }
Save and exit. This configures Logstash Forwarder to ship the HAProxy logs and mark them as haproxy-log, which will be used for filtering the logs.
Restart Logstash Forwarder to start shipping the logs:
sudo service logstash-forwarder restart
HAProxy Log Filter
On the ELK server, logging, open a new file to add our HAProxy log filter to Logstash. We will name it 13-haproxy.conf, so it will be read after the Logstash input configuration (in the 01-lumberjack-input.conf file):
sudo vi /etc/logstash/conf.d/13-haproxy.conf
Add the following filter definition:
filter {
  if [type] == "haproxy-log" {
    grok {
      match => { "message" => "%{SYSLOGTIMESTAMP:timestamp} %{HOSTNAME:hostname} %{SYSLOGPROG}: %{IPORHOST:clientip}:%{POSINT:clientport} \[%{MONTHDAY}[./-]%{MONTH}[./-]%{YEAR}:%{TIME}\] %{NOTSPACE:frontend_name} %{NOTSPACE:backend_name}/%{NOTSPACE:server_name} %{INT:time_request}/%{INT:time_queue}/%{INT:time_backend_connect}/%{INT:time_backend_response}/%{NOTSPACE:time_duration} %{INT:http_status_code} %{NOTSPACE:bytes_read} %{DATA:captured_request_cookie} %{DATA:captured_response_cookie} %{NOTSPACE:termination_state} %{INT:actconn}/%{INT:feconn}/%{INT:beconn}/%{INT:srvconn}/%{NOTSPACE:retries} %{INT:srv_queue}/%{INT:backend_queue} "(%{WORD:http_verb} %{URIPATHPARAM:http_request} HTTP/%{NUMBER:http_version})|<BADREQ>|(%{WORD:http_verb} (%{URIPROTO:http_proto}://))" }
    }
  }
}
Save and exit. This configures Logstash to filter haproxy-log type logs with the Grok patterns specified in the respective match directive. The haproxy-log type logs are being parsed by the Logstash-provided Grok pattern that matches the default HAProxy log message format.
To put these filters to work, let’s restart Logstash:
- sudo service logstash restart
At this point, you will want to ensure that Logstash is running properly, as configuration errors will cause it to fail.
Set Up Kibana Visualizations
Now that you are collecting your logs in a central location, you can start using Kibana to visualize them. This tutorial can help you get started with that: How To Use Kibana Dashboards and Visualizations.
Once you are somewhat comfortable with Kibana, try out this tutorial to visualize your users in an interesting way: How To Map User Location with GeoIP and ELK.
Conclusion
Congratulations! You have completed the Production Web Application Setup tutorial series. If you followed all of the tutorials, you should have a setup that looks like what we described in the overview tutorial (with private DNS and remote backups):
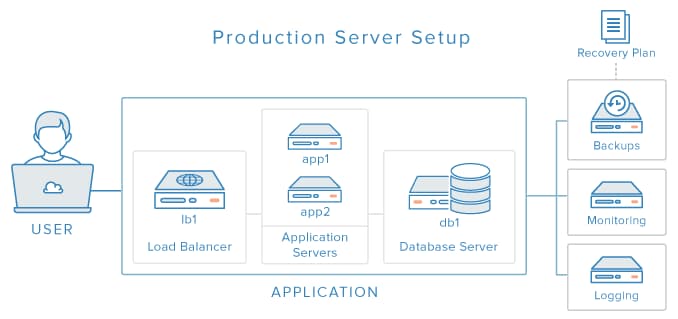
That is, you should have a working application, with decoupled components, that is supported by backups, monitoring, and centralized logging components. Be sure to test out your application, and make sure all of the components work as expected.
Thanks for learning with the DigitalOcean Community. Check out our offerings for compute, storage, networking, and managed databases.
Tutorial Series: Building for Production: Web Applications
This 6-part tutorial will show you how to build out a multi-server production application setup from scratch. The final setup will be supported by backups, monitoring, and centralized logging systems, which will help you ensure that you will be able to detect problems and recover from them. The ultimate goal of this series is to build on standalone system administration concepts, and introduce you to some of the practical considerations of creating a production server setup.
About the author
Software Engineer @ DigitalOcean. Former Señor Technical Writer (I no longer update articles or respond to comments). Expertise in areas including Ubuntu, PostgreSQL, MySQL, and more.
Still looking for an answer?
This textbox defaults to using Markdown to format your answer.
You can type !ref in this text area to quickly search our full set of tutorials, documentation & marketplace offerings and insert the link!
There’s a mistake in the grok filter, the match starts with " and ends with ', whick makes service logstash configtest fail with
Error: Expected one of #, {, } at line 28, column 643 (byte 1337) after filter {
  if [type] == "haproxylog" {
    grok {
      match => { "message" => "%{SYSLOGTIMESTAMP:timestamp} %{HOSTNAME:hostname} %{SYSLOGPROG}: %{IPORHOST:clientip}:%{POSINT:clientport} \[%{MONTHDAY}[./-]%{MONTH}[./-]%{YEAR}:%{TIME}\] %{NOTSPACE:frontend_name} %{NOTSPACE:backend_name}/%{NOTSPACE:server_name} %{INT:time_request}/%{INT:time_queue}/%{INT:time_backend_connect}/%{INT:time_backend_response}/%{NOTSPACE:time_duration} %{INT:http_status_code} %{NOTSPACE:bytes_read} %{DATA:captured_request_cookie} %{DATA:captured_response_cookie} %{NOTSPACE:termination_state} %{INT:actconn}/%{INT:feconn}/%{INT:beconn}/%{INT:srvconn}/%{NOTSPACE:retries} %{INT:srv_queue}/%{INT:backend_queue} "
The line should be
match => { "message" => '%{SYSLOGTIMESTAMP:timestamp} %{HOSTNAME:hostname} %{SYSLOGPROG}: %{IPORHOST:clientip}:%{POSINT:clientport} \[%{MONTHDAY}[./-]%{MONTH}[./-]%{YEAR}:%{TIME}\] %{NOTSPACE:frontend_name} %{NOTSPACE:backend_name}/%{NOTSPACE:server_name} %{INT:time_request}/%{INT:time_queue}/%{INT:time_backend_connect}/%{INT:time_backend_response}/%{NOTSPACE:time_duration} %{INT:http_status_code} %{NOTSPACE:bytes_read} %{DATA:captured_request_cookie} %{DATA:captured_response_cookie} %{NOTSPACE:termination_state} %{INT:actconn}/%{INT:feconn}/%{INT:beconn}/%{INT:srvconn}/%{NOTSPACE:retries} %{INT:srv_queue}/%{INT:backend_queue} "(%{WORD:http_verb} %{URIPATHPARAM:http_request} HTTP/%{NUMBER:http_version})|<BADREQ>|(%{WORD:http_verb} (%{URIPROTO:http_proto}://))"' }
Thanks for this tutorial.
Hello,
When I add HAProxy logs to: /etc/logstash-forwarder.conf
, { “paths”: [ “/var/log/haproxy.log” ], “fields”: { “type”: “haproxy-log” } }
then start logstash-forwarder, but it can’t start
Please help me
Thank you.
Great tutorial. But for those of use new to DO, it would benefit from some advice about the size / type of droplet we should use for each of the nodes in your architecture. Could you add this?
Thanks Chris https://getjirified.com
Hi Mitchell,
Thanks for the tutorial. I have tried shipping Apache logs and it has worked for me. Now I want to ship mail logs (postfix logs) to my ELK stack. Is there any way to do that?
ELK server: Ubuntu 16.04 Elasticsearch: 2.5 Logstash: 2.5 Kibana: 4.5
Best regards, Iqbal
 This work is licensed under a Creative Commons Attribution-NonCommercial- ShareAlike 4.0 International License.
Become a contributor for community
Get paid to write technical tutorials and select a tech-focused charity to receive a matching donation.

DigitalOcean Documentation
Full documentation for every DigitalOcean product.

Resources for startups and AI-native businesses
The Wave has everything you need to know about building a business, from raising funding to marketing your product.
The developer cloud
Scale up as you grow — whether you're running one virtual machine or ten thousand.

Start building today
From GPU-powered inference and Kubernetes to managed databases and storage, get everything you need to build, scale, and deploy intelligent applications.
