By pchakravarthi and Lisa Tagliaferri

Introduction
Benchmarking allows you to estimate infrastructure performance so that you can determine whether or not a particular setup can serve your workload needs. This is an important component of maintaining high server performance and scaling to meet growing computing needs. With benchmark testing, you can monitor server resources, optimize for performance, manage utilization, and predict issues that may occur.
In this tutorial, we’ll go over best practices to benchmark your DigitalOcean Block Storage Volumes by simulating workloads that mimic your application.
Droplet and Block Storage Volume Testing Setup
You’ll want to determine the specifications of the workload you are testing in order to configure an appropriate Droplet and Block Storage Volume setup. If you are benchmarking DigitalOcean Volumes against an alternate product, make sure you select plans with similar configuration so you get a more proximate comparison.
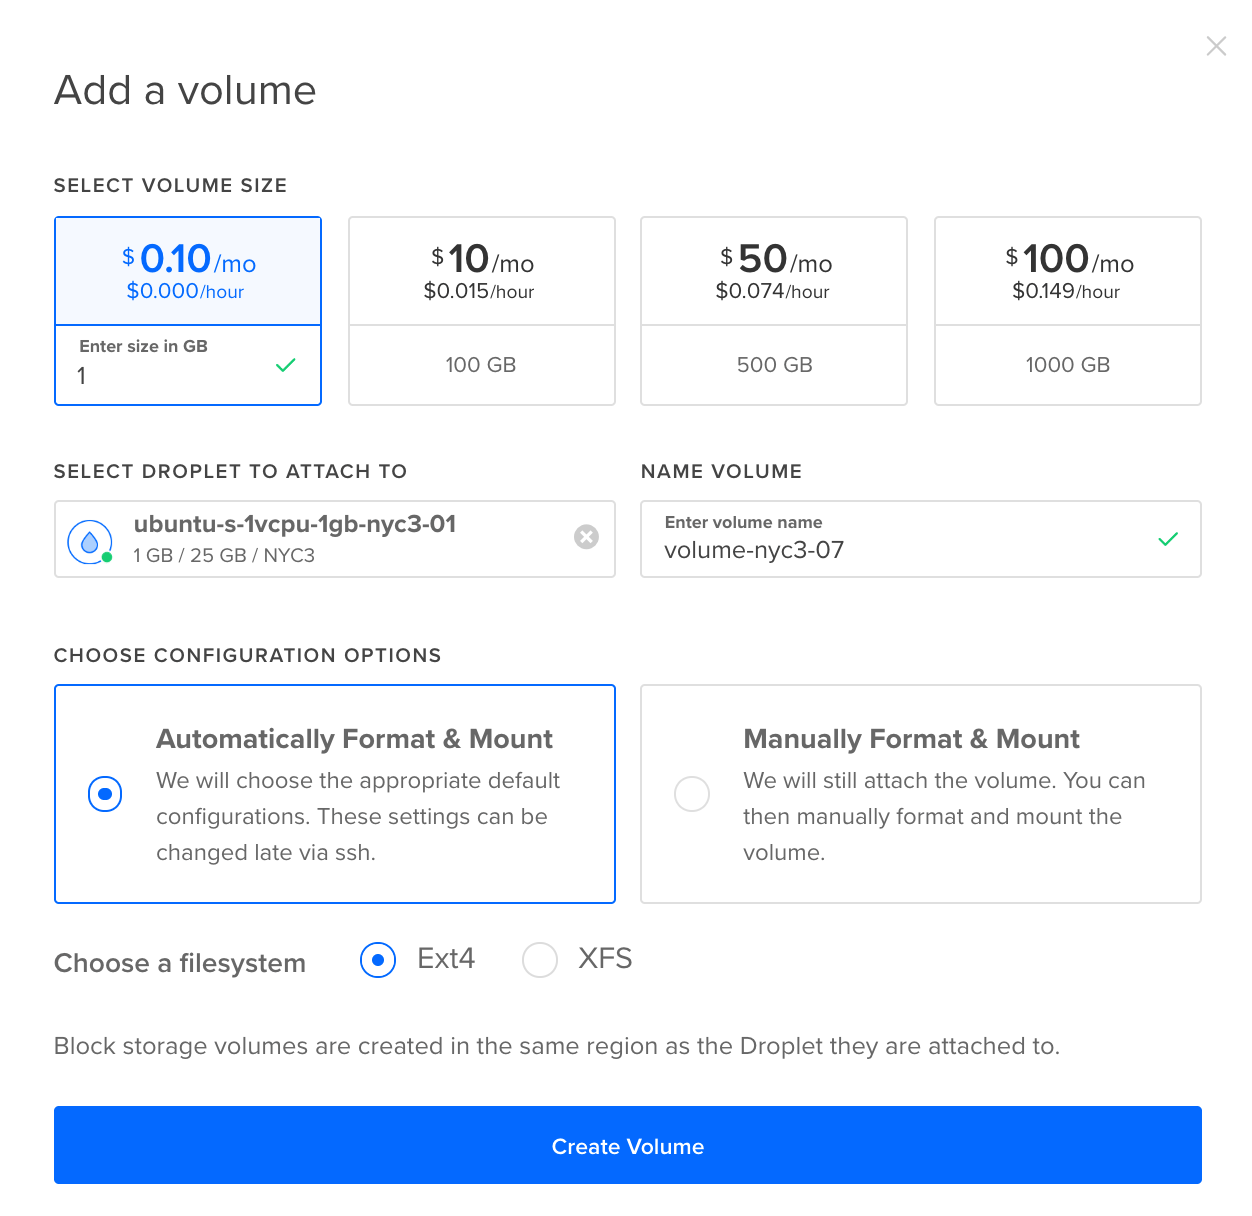
For guidance on setting up a Droplet, refer to our tutorial “How To Create Your First DigitalOcean Droplet.” The Block Storage Volume can be created simultaneously with the Droplet, and in some cases you can create it later from the Volumes tab under Droplets in the Control Panel. To learn more about creating and managing volumes, you can read “An Introduction to DigitalOcean Block Storage.”
Format the volume with the filesystem that meets your performance requirements. The most popular default filesystem is Ext4, which is more performant than previous generations Ext3 and Ext2. The XFS filesystem specializes in performance and large data files. You can read more about filesystems in the “How To Partition and Format DigitalOcean Block Storage Volumes in Linux.” If you have no specific file system or configuration preference, the process of creating and mounting block volumes for you is automated in the Control Panel.
With your setup in place, we can move on to discussing benchmarking tools and configurations you can use to get the most out of your performance testing.
Benchmarking Tools and Configurations
We’ll be discussing the performance measuring tool fio for testing performance, as it is extremely flexible and supported by most distributions. Alternate benchmarking tools you may want to research and use include Bonnie++, btest, and Filebench.
To install fio on an Ubuntu server, you should first update your package list and then install it, by using the following commands:
- sudo apt update
- sudo apt install fio
Each benchmark tool comes with a variety of parameters that you can tune in order to get the optimal performance for your test.
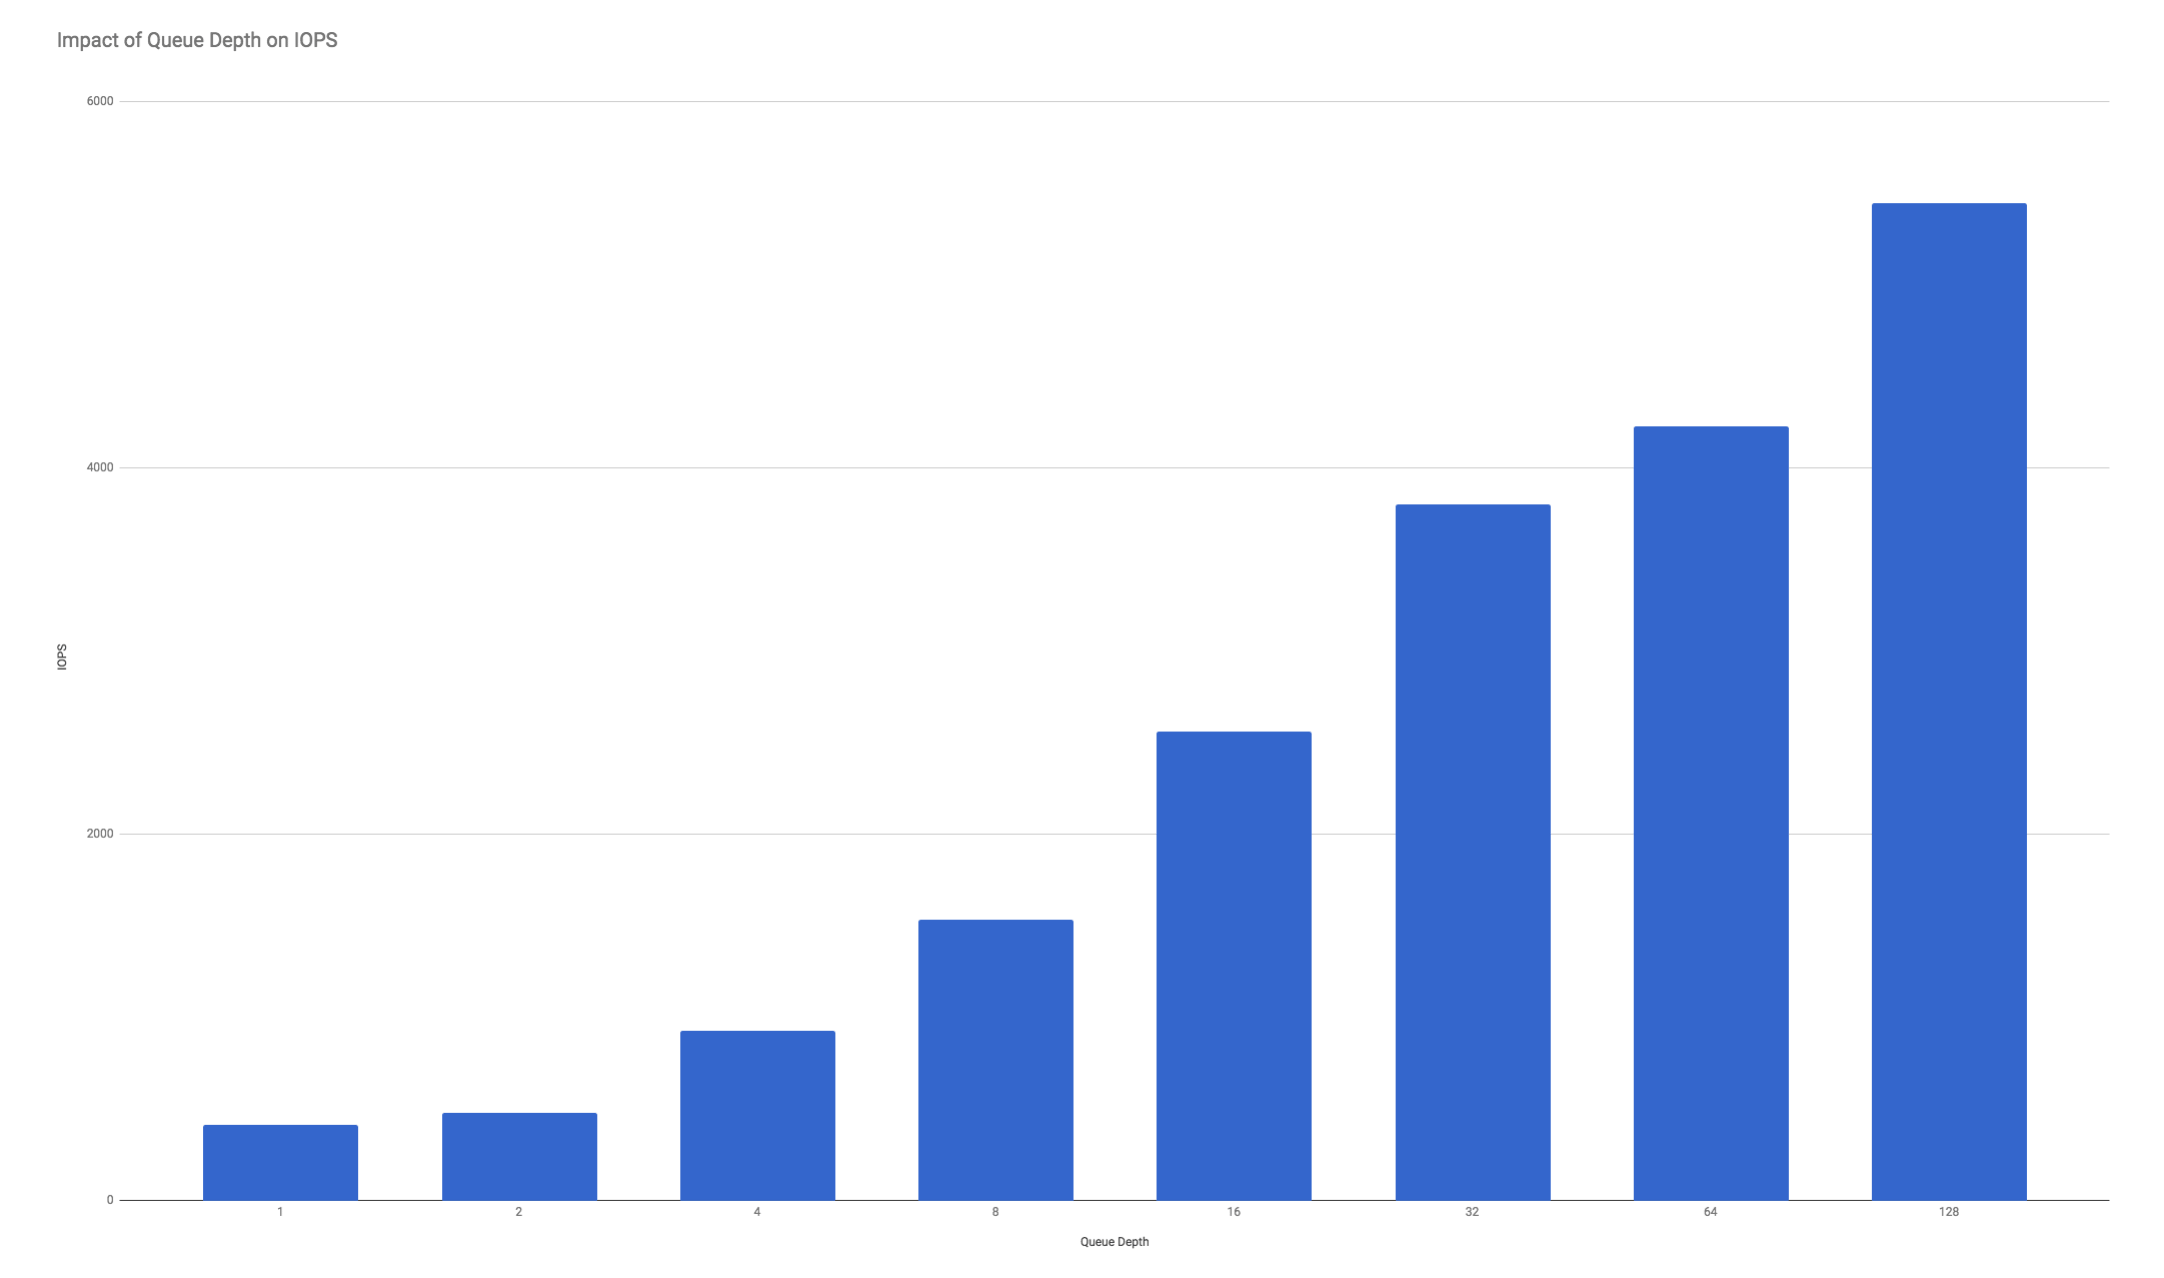
One parameter worth tuning is the queue depth, which is the parallelism at which the volume exhibits the best performance. Usually a queue depth of 1 indicates that the workload cannot start another transaction until the prior transaction has been completed. Only use low queue depth numbers for your tests if you want to simulate a highly parallelized application. Otherwise, keep raising the queue depth until you get the performance you desire for your application.
With the benchmarking tool fio, some typical configuration options include:
| Option | Recommendations |
|---|---|
iodepth |
The queue depth that fio will issue to the file. In order to hit best input/output (I/O) rates, a number greater than iodepth=64 is recommended. |
bs |
Block size in bytes for I/O to use. File systems use 4K for metadata but tend to store files in much larger block sizes. Databases typically issue 8-16K sized I/O. For peak bandwidth tests, we recommend a block size of bs=64k or greater. |
runtime |
The time in seconds to run the benchmark. We recommend a runtime greater than 60 seconds, usually in the range of runtime=120s to runtime=300s. |
ioengine |
The ioengine option defines how the job issues I/O to the file. We recommend ioengine=libaio which refers to Linux native asynchronous I/O. |
direct |
Takes a Boolean value: 0 uses the filesystem cache returning a value closest to the application behavior which may result in higher than typical benchmark results; and 1 skips any file system caching behavior, returning the closest performance to what the block volume can do. We recommend direct=1. |
sync |
Use synchronous I/O for buffered writes. This option takes a Boolean value: 0 means not to force unit access, allowing for writeback cache behavior to operate like it does on normal disk drives with fio behaving more like a filesystem; 1 forces unit access, meaning I/O will not complete until the disk has guaranteed physical placement. We recommend sync=0. |
size |
Size of test file, taking an integer. We typically recommend at least 20 gigabytes. Note that DigitalOcean’s performance does not vary with volume size. |
With these configurations in mind, we can now go over some example benchmark tests that you may want to run.
Running Benchmark Tests
Here are some example benchmarks you can run. In the next section of this tutorial, we’ll go over how to inspect the output you receive in greater depth.
In the following commands, we’re pointing to a fio.test file on a volume based in the NYC3 data center, be sure to update it to point to the specific filesystem you would like to use.
Write Bandwidth
This test performs a random write of 1MB onto the block volumes.
- fio --filename=/mnt/volume-nyc3-04/fio.test \
- --direct=1 \
- --rw=randwrite \
- --ioengine=libaio \
- --bs=1024K \
- --iodepth=32 \
- --name=bw-test \
- --runtime=120s \
For a standard Droplet, we expect output of 200MB/sec. If you’re working with a High CPU Droplet, you should expect output of 300MB/sec.
Random Read Test
This will measure how quickly multiple small files can be read from a device.
- fio --filename=/mnt/volume-nyc3-04/fio.test \
- --direct=1 \
- --rw=randread \
- --ioengine=libaio \
- --bs=4K \
- --iodepth=128 \
- --name=rand-r \
- --runtime=120s \
For a standard Droplet we expect output of 5000 I/O operations per second (IOPS). For a High CPU Droplet, we expect an output greater than 6000 IOPS.
Random Write Test
This will measure how quickly multiple small files can be written.
- fio --filename=/mnt/volume-nyc3-04/fio.test \
- --direct=1 \
- --rw=randwrite \
- --ioengine=libaio \
- --bs=4K \
- --iodepth=128 \
- --name=rand-w \
- --runtime=120s \
An output of 5000 IOPS is what we expect for a standard Droplet, while an output that is greater than 6000 IOPS is what we expect for a High CPU Droplet.
Read Latency Test
We’ll determine the time required to find and access the proper data blocks on the disk with a read latency test.
- fio --filename=/mnt/volume-nyc3-04/fio.test \
- --direct=1 \
- --rw=randread \
- --ioengine=libaio \
- --bs=4K \
- --iodepth=1 \
- --name=lat-read \
- --runtime=120s \
For this test, we expect an output that returns less than 5ms.
Write Latency Test
This test measures the delay from when a disk write request is created until it’s completed.
- fio --filename=/mnt/volume-nyc3-04/fio.test \
- --direct=1 \
- --rw=randwrite \
- --ioengine=libaio \
- --bs=4K \
- --iodepth=1 \
- --name=lat-write \
- --runtime=120s \
Here, we also expect an output of less than 5ms for this test.
Inspecting Output
Once you run your test, you’ll be inspecting the resulting output to examine how many read and write operations were serviced by DigitalOcean Volumes. You’ll want to pay attention to how long it took for each test to complete.
Below is sample output from a write bandwidth test.
- fio --filename=/mnt/volume-nyc3-04/test.fio --direct=1 --rw=randwrite --ioengine=libaio --bs=1024k --iodepth=32 --name=bw-test --runtime=120s
Outputbw-test: (groupid=0, jobs=1): err= 0: pid=2584: Fri Apr 20 17:14:19 2018
  write: io=22937MB, bw=195468KB/s, iops=190, runt=120160msec
    slat (usec): min=54, max=622, avg=135.46, stdev=23.21
    clat (msec): min=7, max=779, avg=167.48, stdev=26.28
     lat (msec): min=7, max=779, avg=167.62, stdev=26.28
    clat percentiles (msec):
     |  1.00th=[  101],  5.00th=[  155], 10.00th=[  159], 20.00th=[  163],
     | 30.00th=[  165], 40.00th=[  167], 50.00th=[  167], 60.00th=[  167],
     | 70.00th=[  169], 80.00th=[  169], 90.00th=[  172], 95.00th=[  178],
     | 99.00th=[  306], 99.50th=[  363], 99.90th=[  420], 99.95th=[  474],
     | 99.99th=[  545]
    bw (KB  /s): min=137730, max=254485, per=100.00%, avg=195681.88, stdev=9590.24
    lat (msec) : 10=0.01%, 20=0.03%, 50=0.37%, 100=0.58%, 250=97.55%
    lat (msec) : 500=1.44%, 750=0.03%, 1000=0.01%
  cpu          : usr=1.76%, sys=1.83%, ctx=22777, majf=0, minf=11
  IO depths    : 1=0.1%, 2=0.1%, 4=0.1%, 8=0.1%, 16=0.1%, 32=99.9%, >=64=0.0%
     submit    : 0=0.0%, 4=100.0%, 8=0.0%, 16=0.0%, 32=0.0%, 64=0.0%, >=64=0.0%
     complete  : 0=0.0%, 4=100.0%, 8=0.0%, 16=0.0%, 32=0.1%, 64=0.0%, >=64=0.0%
     issued    : total=r=0/w=22937/d=0, short=r=0/w=0/d=0, drop=r=0/w=0/d=0
     latency   : target=0, window=0, percentile=100.00%, depth=32

Run status group 0 (all jobs):
  WRITE: io=22937MB, aggrb=195468KB/s, minb=195468KB/s, maxb=195468KB/s, mint=120160msec, maxt=120160msec
The highlighted line in the output above shows our average bandwidth as bw=195468KB/s, as well as our I/O operations per second (IOPS) as iops=190. In this particular scenario, the IOPS is low because we were performing 1MB writes at a peak rate of 200MB per second (190iops * 1M =~ 190MB/sec).
When performing a read latency test, you will receive the metrics on lines that look like the following:
Outputlat-read: (groupid=0, jobs=1): err= 0: pid=2628: Fri Apr 20 17:32:51 2018
  read : io=855740KB, bw=7131.2KB/s, iops=1782, runt=120001msec
    slat (usec): min=8, max=434, avg=16.77, stdev= 5.92
    clat (usec): min=2, max=450994, avg=539.15, stdev=2188.85
     lat (usec): min=53, max=451010, avg=556.61, stdev=2188.91
In the example above, we can see that I/O latency is 556 usec or microseconds (or .5 ms or milliseconds). This indicates the time it takes to perform a single 4K I/O to the block volume.
Latency is impacted by several factors, including the performance of the storage system, the size of the I/O, the queue depth, and any throttle limits that are triggered.
When your benchmark tests are complete, you can delete the Droplet and the volume.
Understanding the Performance Results
Note: DigitalOcean Block Storage Volumes have additional performance enhancing features (like bursting) that may result in higher than typical benchmarks. The effect of this can be mitigated by running a profile longer then a few seconds.
DigitalOcean Block Storage Volumes are SAN-based SSD storage. Because of this, the performance of a given volume scales with the block size and queue depth. That is, the storage performs best when it is given a lot of work to do all at the same time.
Below is a graph showing an example of performance on parallelism. Click the image to expand it.
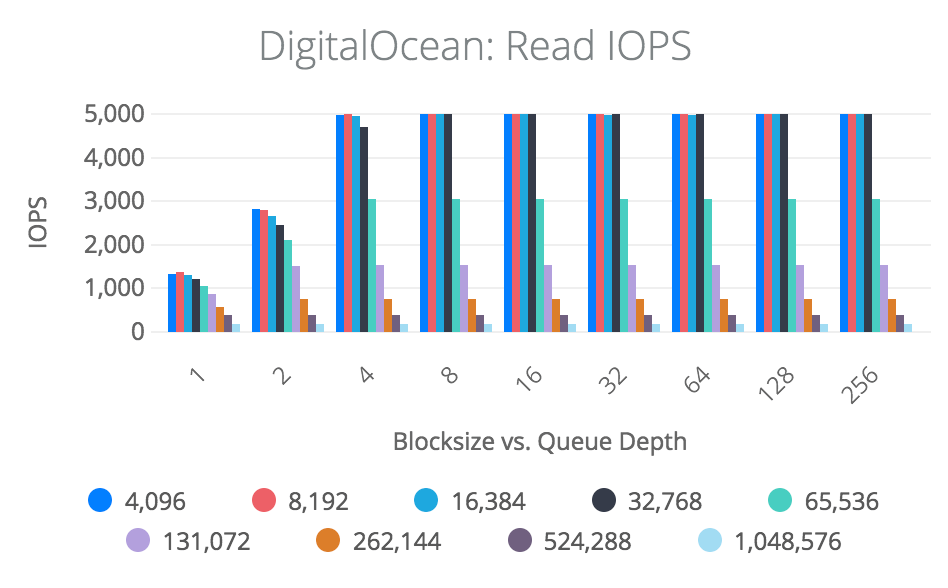
DigitalOcean performance is limited by max IOPS and max bandwidth, whichever is reached first. On DigitalOcean, performance does not change with volume size. However, because IOPS and bandwidth are capped at certain rates, there is a crossover effect. That is, increasing queue depth on small-sized I/O will not reach peak bandwidth of 200MB/sec as it will hit the IOPS limit instead. For large blocks, peak IOPS of 5000 will not be reached as it will hit the bandwidth limit of 200MB/sec instead.
As a rule of thumb, using a block size of 32K or greater will result in less than 5000 IOPS because it will hit the bandwidth limit of 200MB/sec, while using a block size or 16K or less will result in less than the bandwidth limit of 200MB/sec because it will hit 5000 IOPS.
As a practical example, let’s compare IOPS and bandwidth.
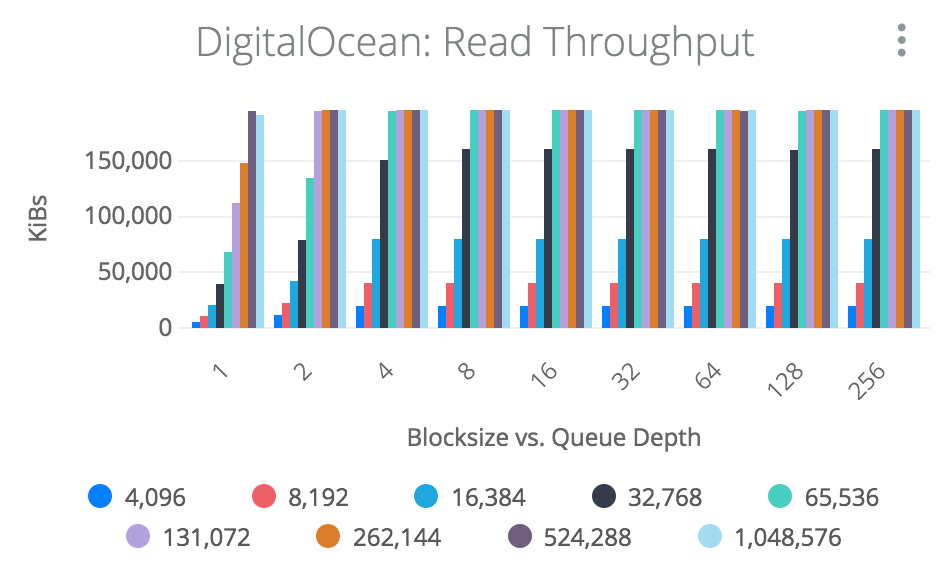
The first graph shows typical bandwidth given a block size and queue depth of an application. We’ll consider two different block sizes of 4K and 256K.
When looking at the 4K values we see that it hits 5000 IOPS at a queue depth of 4, but we only ever see it hit a bandwidth of 20MB/sec. That is because 5000 IOPS * 4K = 20MB/sec. This means that a 4K workload will never exceed 20MB/sec since it is I/O capped.
When looking at the 256K workload, we see that it reaches 200MB/sec at a queue depth of 2, but it will never see an IOPS rate higher than 800 IOPS because 200MB/sec / 256K = 800 IOPS.
DigitalOcean Block Storage Volumes are tuned for typical filesystem workloads of 16K-64K. At these block sizes, we see a good tradeoff between IOPS and bandwidth.
| Block Size | IOPS | Bandwidth |
|---|---|---|
| 4K | ~5000 IOPS | ~20MB/sec |
| 16K | ~5000 IOPS | ~80MB/sec |
| 32K | ~5000 IOPS | ~160MB/sec |
| 64K | ~3200 IOPS | ~200MB/sec |
| 256K | ~800 IOPS | ~200MB/sec |
Once you receive the output from benchmarking a simulated I/O workload, you’ll be able to analyze the best setup based on the needs of your app.
Conclusion
In this guide, we covered how to carry out benchmarking your DigitalOcean Droplets and Block Storage Volumes in order to simulate anticipated workflows. Incorporating benchmark testing as part of your workflow can ensure that you maintain appropriate scale for your applications and predict issues before they arise.
To continue learning more about how to work with DigitalOcean Block Storage, you can read “How to Create an Encrypted File System on a DigitalOcean Block Storage Volume” and “How To Work with DigitalOcean Block Storage Using Doctl.”
Thanks for learning with the DigitalOcean Community. Check out our offerings for compute, storage, networking, and managed databases.
About the author(s)
Community and Developer Education expert. Former Senior Manager, Community at DigitalOcean. Focused on topics including Ubuntu 22.04, Ubuntu 20.04, Python, Django, and more.
Still looking for an answer?
This textbox defaults to using Markdown to format your answer.
You can type !ref in this text area to quickly search our full set of tutorials, documentation & marketplace offerings and insert the link!
Hi Authors, thank you for this article, I found it very helpful. One issue - it appears the --size parameter is missing in the random read and random write scripts, they fail without it.
 This work is licensed under a Creative Commons Attribution-NonCommercial- ShareAlike 4.0 International License.
Become a contributor for community
Get paid to write technical tutorials and select a tech-focused charity to receive a matching donation.

DigitalOcean Documentation
Full documentation for every DigitalOcean product.

Resources for startups and AI-native businesses
The Wave has everything you need to know about building a business, from raising funding to marketing your product.
The developer cloud
Scale up as you grow — whether you're running one virtual machine or ten thousand.

Start building today
From GPU-powered inference and Kubernetes to managed databases and storage, get everything you need to build, scale, and deploy intelligent applications.
