By Vadym Kalsin and Tammy Fox

Introduction
If you use a monitoring system (like Zabbix or Nagios) then you know how monitoring works. In a nutshell it can be described as follows: A monitoring system receives various metrics (CPU/memory usage, network utilization, and more). As soon as the value of one of the metrics goes outside the predetermined thresholds, it activates the corresponding trigger, and the monitoring system informs you that one of the metrics is outside normal limits. Thresholds for each metric are usually set manually, which is not always convenient.
In this tutorial you will learn how to install and configure Skyline — a real-time anomaly detection system. It is able to analyze a set of metrics in real time without setting or adjusting the thresholds for each one. It is designed to be used wherever there is a large number of time series (hundreds of thousands) that need constant monitoring.
Threshold Triggers
Let’s look at an example of a monitoring system with manually set thresholds. The figure below shows a graph for CPU load. Dashed lines indicate the thresholds of the trigger.
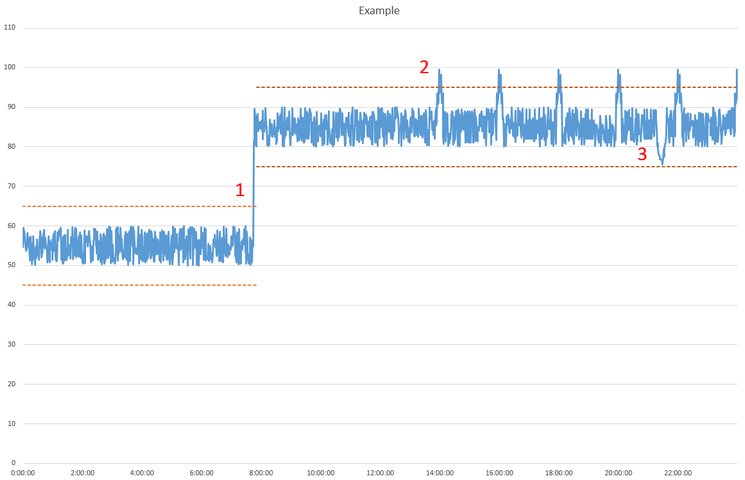 Figure 1
At point 1 in Figure 1, a process has started, and the CPU load has significantly increased. The trigger has been activated, and the administrator notices it. The administrator decides that it is within normal values and changes the trigger thresholds to the ones shown as the upper dashed lines.
After some time has passed, the trigger is fired again at point 2 in Figure 1. The administrator discovers that a second service is regularly making backups and causing the load increase. Then the question arises: Do you raise the threshold higher or leave it as is but just ignore the alarms?
Let’s take a look at point 3. At that moment, the event load falls, but the administrator was not informed because the threshold was not exceeded. The trigger didn’t activate.
This simple case shows us that there are some difficulties when trying to set thresholds. It is hard to adjust the threshold values to catch performance issues without triggering false positive errors or false negative errors.
To help solve these problems, Skyline has been created. It’s using a set of nonparametric algorithms to classify anomalous metrics.
Skyline Components
Skyline consists of the following components: Horizon Agent, Analyzer Agent, and Webapp.
Horizon Agent
The Horizon Agent is responsible for collecting data. It has Listeners, which listen for incoming data.
It accept the data in two formats: pickle (TCP) and MessagePack (UDP). It reads incoming metrics and puts them in a shared queue that the Workers read from. Workers encode the data into Messagepack and append it to the Redis database. The Horizon Agent also regularly trims and cleans old metrics using Roombas. If this is not done, then all free memory will soon be exhausted.
Analyzer Agent
The Analyzer Agent is responsible for analyzing the data. It receives a list of metrics from Redis, runs several processes, and assigns metrics to each of them. Each process analyzes the data using several algorithms. Each algorithm reports the result — whether data is abnormal or not. If the majority of the algorithms report that the current metric has abnormality, the data is considered anomalous.
All abnormal metrics are written to a file. On the basis of this file, an image is created and shown in the web application.
Analyzer can also send notifications: email, HipChat, or PagerDuty. Email notifications are configured later in this article.
Webapp
Skyline provides a small web application to display the abnormal metrics. It’s a simple web app written in Python with a Flask framework. The upper part shows two graphs — the past hour and the past day. Below the graphs is a list of all the abnormal metrics.
Redis Database
Redis is an open source key-value cache and store database.
Skyline stores all the metrics and encoded time series in a Redis database. When a data point comes in, a Horizon worker packs the datapoint with the schema [timestamp, value] into a MessagePack-encoded binary string and append this string to the appropriate metric key.
Figure 2 shows the diagram of interactions of the Skyline’s components.
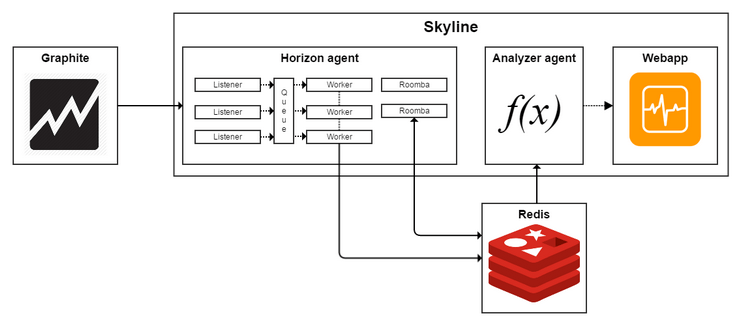 Figure 2
Prerequisites
Before you can install Skyline, you need the complete the following prerequisites:
- Deploy a CentOS 7 Droplet.
- Add a sudo user by following the Initial Server Setup tutorial. All the commands in this tutorial should be run as this non-root user.
- Add swap space to your server. 4 GB is fine.
- Install Graphite and collectd by following the instructions in the How To Keep Effective Historical Logs with Graphite, Carbon, and collectd on CentOS 7 tutorial.
Step 1 — Installing Skyline and Redis
To install Skyline, first install the required applications including some Python-related tools and the Apache web server:
- sudo yum install httpd gcc gcc-c++ git pycairo mod_wsgi python-pip python-devel blas-devel lapack-devel libffi-devel
Get the latest source files for Skyline from GitHub:
- cd /opt
- sudo git clone https://github.com/etsy/skyline.git
Install some required Python packages:
- cd /opt/skyline
- sudo pip install -U six
- sudo pip install -r requirements.txt
Install the following Python packages in this specified order:
- sudo pip install numpy
- sudo pip install scipy
- sudo pip install pandas
- sudo pip install patsy
- sudo pip install statsmodels
- sudo pip install msgpack-python
Installation of some packages may take a long time, so please be patient.
Most of them are open source Python libraries used for scientific and technical computing. The msgpack-python package is necessary for reading and writing MessagePack data.
Copy the example Skyline settings file to the correct file location:
- sudo cp /opt/skyline/src/settings.py.example /opt/skyline/src/settings.py
Create the following directories:
- sudo mkdir /var/log/skyline
- sudo mkdir /var/run/skyline
- sudo mkdir /var/log/redis
- sudo mkdir /var/dump/
As we mentioned above, Skyline stores all the metrics in a Redis database, so you need to install it as well:
- sudo yum install redis
You can find more information about Redis from the tutorial How To Install and Use Redis.
Start the Skyline and Redis services:
- cd /opt/skyline/bin
- sudo redis-server redis.conf
- sudo ./horizon.d start
- sudo ./analyzer.d start
- sudo ./webapp.d start
To test the installation, run the included test script:
- python /opt/skyline/utils/seed_data.py
You should see the following output:
- Loading data over UDP via Horizon...
- Connecting to Redis...
- Congratulations! The data made it in. The Horizon pipeline seems to be working.
The installation and basic configuration of Skyline is finished. Now you need to send data into it.
Step 2 — Getting Data into Skyline
As previously mentioned, the Skyline accepts data in two formats: pickle (TCP) and MessagePack (UDP).
You can write your own script or module to your favorite monitoring agent and have it encode the data with MessagePack to be sent to Skyline for analysis. Skyline accepts metrics in the form of MessagePack encoded strings over UDP. MessagePack is an object serialization specification like JSON. The format is [<metric name>, [<timestamp>, <value>]]. MessagePack has an API for most programming languages. More information and API examples can be find on the MessagePack official site.
This tutorial will show you how to send the data from Graphite and collectd to Skyline.
Getting Data from Graphite
Graphite consists of several components, one of which is the carbon-relay service. Carbon-relay forwards incoming metrics to another Graphite instance for redundancy. So you can point the carbon-relay service to the host where Skyline is running.
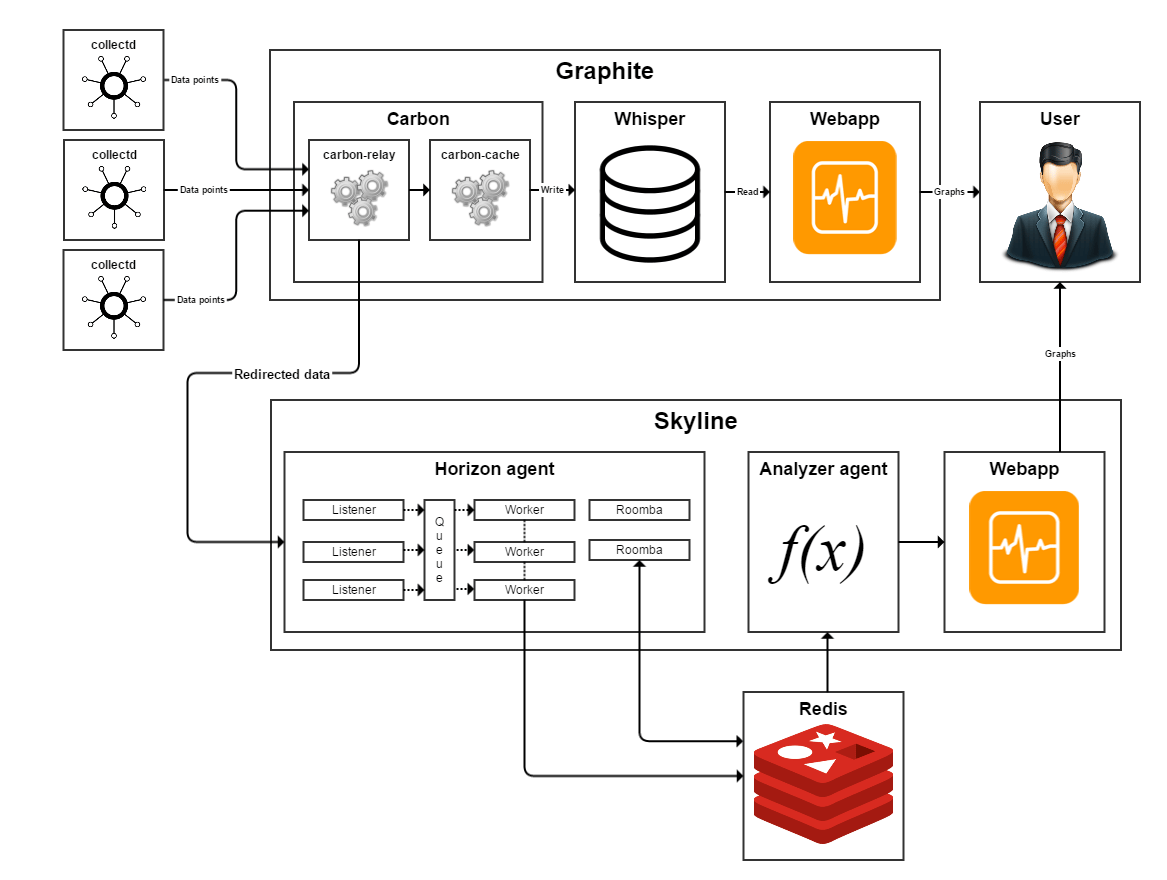 Figure 3
Figure 3 shows a schematic diagram of the data flow. Data from external monitoring agents (collectd, diamond, statsd etc.) or systems (Nagios, Icinga, Sensu etc.) are transferred into Graphite. Next, carbon-relay forwards the data into Skyline. Carbon-relay, carbon-cache, and Skyline may run either on a single host or on separate hosts.
You need to configure Graphite, collectd, and Skyline to get this data flow working.
If you did not copy the example relay-rules.conf to the proper location for the carbon-relay configuration file earlier, you have to do it now:
- sudo cp /opt/graphite/conf/relay-rules.conf.example /opt/graphite/conf/relay-rules.conf
Let’s open the relay-rules.conf configuration file for editing:
- sudo vi /opt/graphite/conf/relay-rules.conf
Add your Skyline host to the list of destinations, where YOUR_SKYLINE_HOST is the IP address of your Skyline host:
[default]
default = true
destinations = 127.0.0.1:2004, YOUR_SKYLINE_HOST:2024
All destinations used in relay-rules.conf must also be defined in carbon.conf configuration file.
Open the carbon.conf configuration file to make this change:
- sudo vi /opt/graphite/conf/carbon.conf
Then locate the [relay] section, and edit the DESTINATIONS line:
[relay]
...
DESTINATIONS = 127.0.0.1:2004, YOUR_SKYLINE_HOST:2024
...
Once you have made these changes, start the carbon-relay service:
- sudo systemctl start carbon-relay
Allowing Skyline Access to Graphite-Web
In How To Keep Effective Historical Logs with Graphite, Carbon, and collectd on CentOS 7, if you elected to password-protect the Graphite web interface, you must allow access from localhost without password for Skyline to work.
To do so, edit the Graphite configuration file:
- sudo vi /etc/httpd/conf.d/graphite.conf
Add the following lines in red to the <Location> block:
<Location "/">
  AuthType Basic
  AuthName "Private Area"
  AuthUserFile /opt/graphite/secure/.passwd
  Require user sammy
	Order Deny,Allow
	Deny from all
	Allow from localhost
	Satisfy Any
</Location>
Then restart the Apache service:
- sudo systemctl restart httpd
Getting Data from Collectd
You can also configure collectd to send data to Skyline. Open its configuration file:
- sudo vi /etc/collectd.conf
Change the port number in the <Plugin write_graphite> block to 2013:
<Plugin write_graphite>
	. . .
	Port "2013"
	. . .
Then restart collectd:
- sudo systemctl restart collectd.service
To avoid confusion, Figure 4 shows a simplified scheme with the correct port numbers.
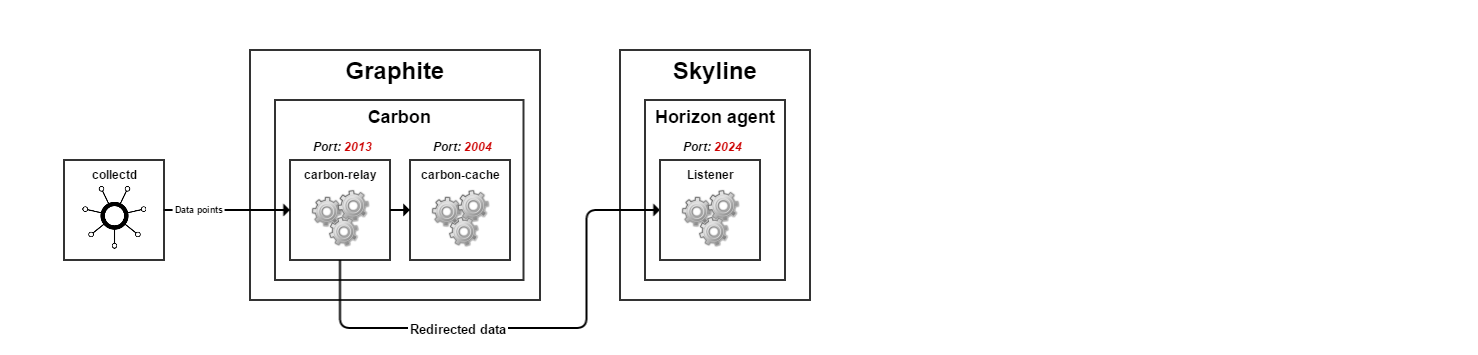 Figure 4
The correct port numbers are as follows:
- Carbon-relay listens for incoming data in plaintext format on port 2013
- Carbon-relay sends the data in pickle format
- Carbon-cache listens for incoming data in pickle format on port 2004
- Horizon agent listens for incoming data in pickle format on port 2024
Attention! If you start the Horizon agent and the optional carbon-aggregator on the same host, you must change their ports. By default they are both set to the same port 2024.
Step 3 — Setting Up Skyline
The Skyline configuration file contains many settings. Open the file for editing:
- sudo vi /opt/skyline/src/settings.py
Each setting within this file is documented via informative comments in the file itself. At a minimum, you need to set the following parameters, replacing the text in red with your values:
GRAPHITE_HOST = 'YOUR_GRAPHITE_HOST'HORIZON_IP = '0.0.0.0'WEBAPP_IP = 'YOUR_SKYLINE_HOST_IP'
The other options can be left to their default values. They are as follows:
FULL_DURATION— This option specifies the maximum length of time for which the data will be stored in Redis and analyzed. Longer durations take longer to analyze, but they can help reduce the noise and provide more accurate anomaly detection. Default value is86400seconds.CARBON_PORT— This option specifies the carbon port. Default value is2003.ANALYZER_PROCESSES— This option specifies the number of processes that the Skyline analyzer will spawn. It is recommended to set this parameter to several less than the total number of CPUs on your host. Default value is5.WORKER_PROCESSES— This option specifies the number of worker processes that will consume from the Horizon queue. Default value is2.PICKLE_PORT— This option specifies the TCP port that listens for Graphite’s pickles. Default value is2024.UDP_PORT— This option specifies the UDP port that listens for MessagePack-encoded packets. Default value is2025.WEBAPP_PORT— This option specifies the port for the Skyline webapp. Default value is1500.
After making these changes you have to restart the corresponding app:
- sudo /opt/skyline/bin/horizon.d restart
- sudo /opt/skyline/bin/analyzer.d restart
- sudo /opt/skyline/bin/webapp.d restart
Then you can open the link http://your_server_ip:1500 and see the Skyline webpage (Figure 5). It will display anomalous metric as they are found.
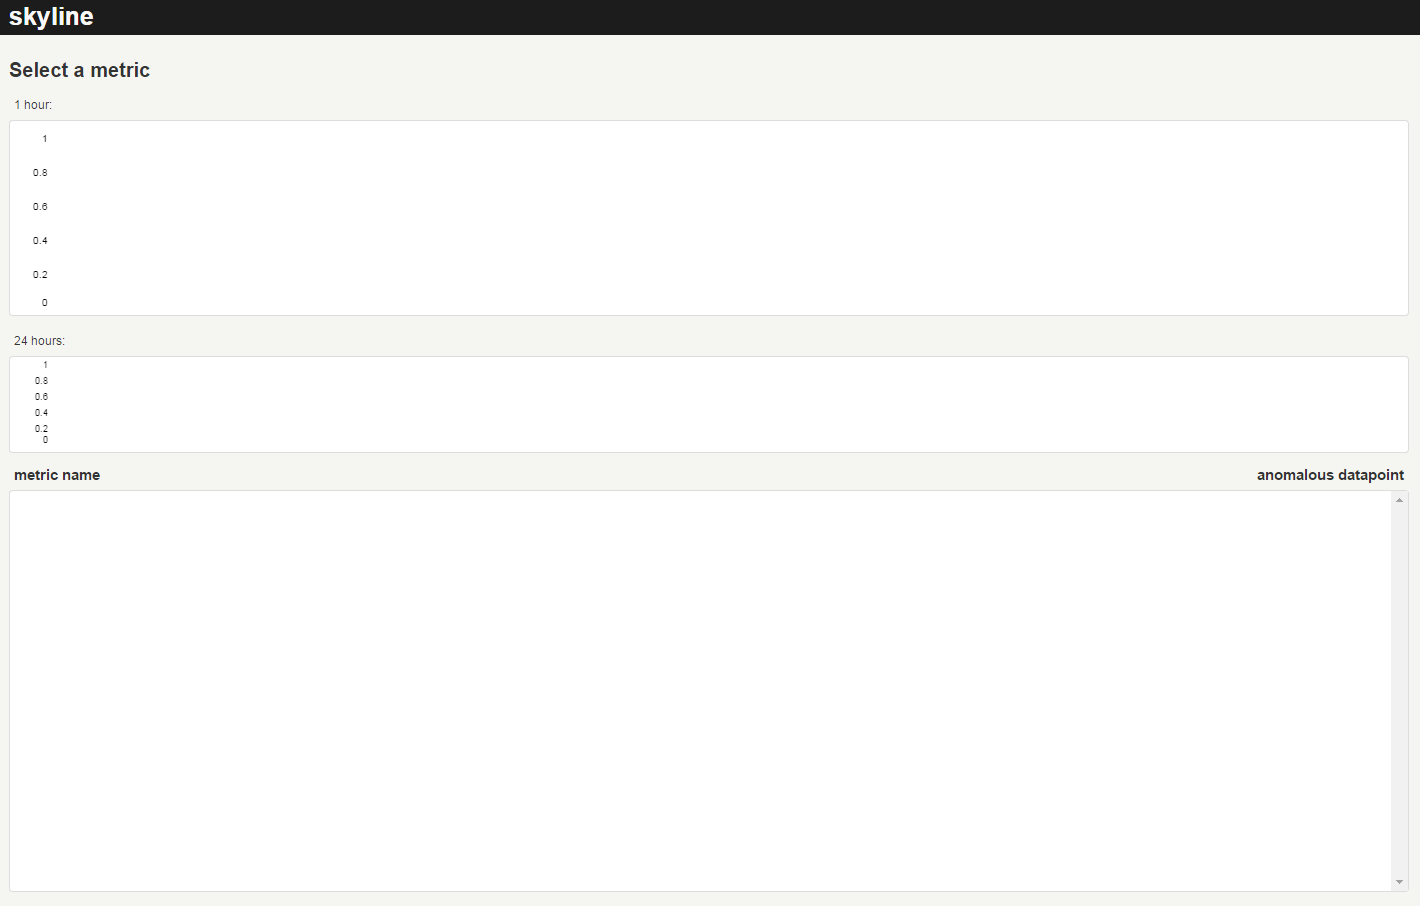 Figure 5
For Skyline to operate in its full capacity, you need to wait until the FULL_DURATION seconds has passed. By default, FULL_DURATION is set to 1 day (86400 seconds).
You should wait at least one hour to start to track anomalies. This will give Skyline time to accumulate information about the normal load levels. Try not to create extra load on the system while Skyline is establishing a baseline.
Step 4 — Enabling Email Alerts
By default, Skyline displays detected anomalies in its web interface (http://your_server_ip:1500) as they are found and while they are still occurring. As soon as an anomaly disappears, its corresponding metric disappears from this interface. Therefore, you must monitor the webpage to see these anomalies, which is not always convenient.
You can configure email alerts so you don’t miss them.
To do so, open the Skyline configuration file:
- sudo vi /opt/skyline/src/settings.py
Make sure alerts are enabled:
ENABLE_ALERTS = True
Then find the following ALERTS section and add the following schema in red:
ALERTS = (
	(^)("collectd", "smtp", 1800)(^),
)
The first value in the schema is the process to monitor. In this case, it is collectd. The second value of the schema is smtp, which stands for email alerts. The last value of 1800 is in seconds. It means that alerts will not fire more than once within 30 minutes (1800 seconds) even if a trigger is detected. Modify this value to best suite your needs.
Also find the following section and modify it for the email addresses you want to use. Email alerts will be sent to the (^)administrator@example.com(^) account from (^)skyline-alerts@example.com(^).
SMTP_OPTS = {
	"sender": "(^)skyline-alerts@example.com(^)",
	"recipients": {
		"collectd": ["(^)administrator@example.com(^)"],
	},
}
After making all these changes, you have to restart analyzer daemon:
- sudo /opt/skyline/bin/analyzer.d restart
Step 5 — Testing Skyline
To test Skyline, we can create a CPU spike with a bash command:
- dd if=/dev/zero of=/dev/null
You can stop the command at any time by pressing CTRL-C. Several minutes should be enough to create an anomaly.
If you look at the Skyline web interface while running this command you will see the detected anomalies. An example is shown in Figure 6.
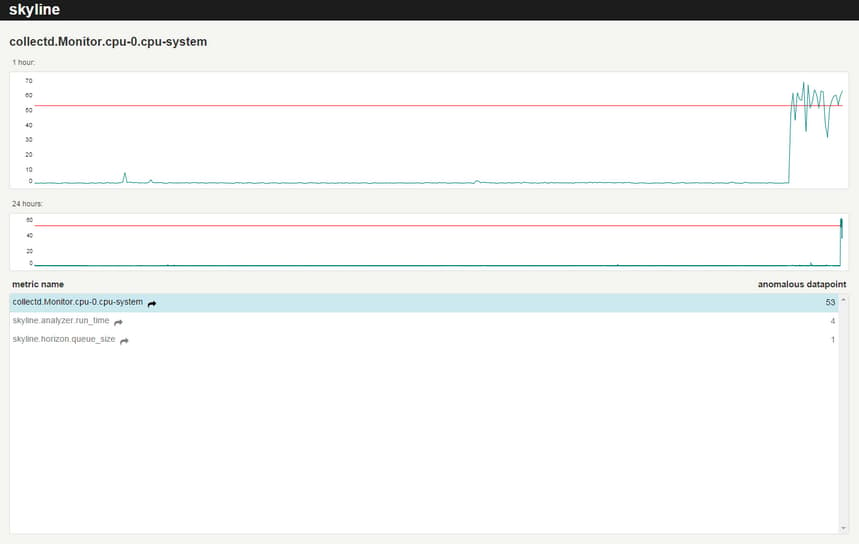 Figure 6
You can see that as a result of high CPU load, the speed of Skyline’s components decreased. All detected abnormal metrics are displayed as a list at the bottom of the webpage. When you hover over the name of one of the metrics, in the upper graphs you can see the corresponding time series for the last hour and the day. Clicking on the name of the metric to open a more detailed graph, generated by Graphite (see Figure 7 for an example).
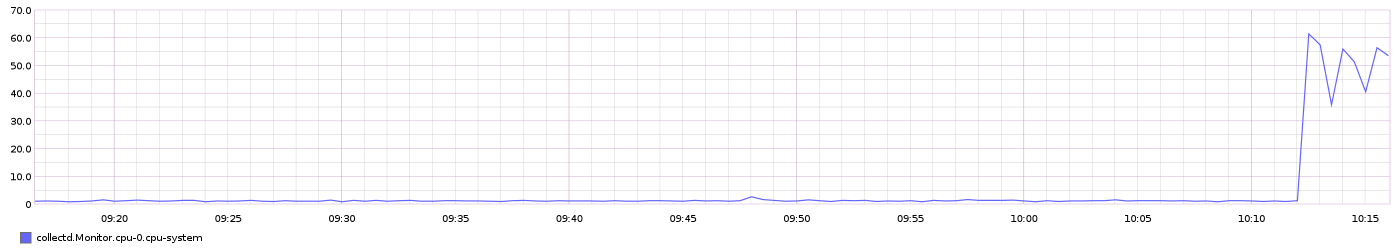 Figure 7
CPU load did not reach extremely high value in this example, and the threshold was not exceeded. In this case a classical monitoring system was not able to find a deviation. Such case was mentioned earlier (Figure 1, point 3).
Unlike classical monitoring systems, Skyline can quickly find deviations and notify you about them.
Step 6 — Adjusting Algorithms (Optional)
As was mentioned earlier, Skyline is using a set of algorithms to detect anomalies. The following algorithms are currently implemented:
- Mean absolute deviation
- Grubbs’ test
- First hour average
- Standard deviation from average
- Standard deviation from moving average
- Least squares
- Histogram bins
- Kolmogorov–Smirnov test
Most of them are based on the сontrol charts (also known as Shewhart charts) and the three-sigma rule. They use Python libraries SciPy and NumPy in their calculations.
You can customize any of the used algorithms. You can also modify, delete, or add new ones. To do this, you must edit the configuration file:
sudo vi /opt/skyline/src/analyzer/algorithms.py
Each of the algorithms in this file is provided with a small description. For example, let’s examine the following algorithm:
def median_absolute_deviation(timeseries):
    """
    A timeseries is anomalous if the deviation of its latest datapoint with
    respect to the median is X times larger than the median of deviations.
    """

    series = pandas.Series([x[1] for x in timeseries])
    median = series.median()
    demedianed = np.abs(series - median)
    median_deviation = demedianed.median()

    # The test statistic is infinite when the median is zero,
    # so it becomes super sensitive. We play it safe and skip when this happens.
    if median_deviation == 0:
        return False

    test_statistic = demedianed.iget(-1) / median_deviation

    # Completely arbitary...triggers if the median deviation is
    # 6 times bigger than the median
    if test_statistic > 6:
        return True
Based on the nature of your data, you may need to change the threshold value from 6 to something else - 4, 5, 7 etc.
You can also tune some the settings in the settings.py file:
ALGORITHMS = [
	'first_hour_average',
	'mean_subtraction_cumulation',
     'stddev_from_average',
     'stddev_from_moving_average',
     'least_squares',
     'grubbs',
     'histogram_bins',
     'median_absolute_deviation',
     'ks_test',
]

CONSENSUS = 6
The ALGORITHMS option specifies the algorithms that the Analyzer will run. You can comment any of them out to disable them or add new algorithms. The CONSENSUS option specifies the number of algorithms that must return True before a metric is classified as anomalous. To increase the sensitivity, you can reduce this option, and vice versa.
Conclusion
Skyline is well proven in complex dynamically changing IT-systems. It may be useful to programmers who regularly make changes to the operating system and want to quickly detect anomalies in system metrics after a new software release.
Its main advantages include:
- High speed analysis of large amounts of data
- No need to set individual parameters for each metric
- Ability to add your own algorithms for anomaly detection
It also has some disadvantages:
- Data of each of the metrics is analyzed by several algorithms that require significant computing system resources.
- All data is stored in RAM, which allows the system to operate very quickly. With a large number of metrics and a long period of analysis you will need a large amount of the RAM.
Thanks for learning with the DigitalOcean Community. Check out our offerings for compute, storage, networking, and managed databases.
About the author(s)
Monitoring engineer
Technical Editor, DigitalOcean
Still looking for an answer?
This textbox defaults to using Markdown to format your answer.
You can type !ref in this text area to quickly search our full set of tutorials, documentation & marketplace offerings and insert the link!
 This work is licensed under a Creative Commons Attribution-NonCommercial- ShareAlike 4.0 International License.
Become a contributor for community
Get paid to write technical tutorials and select a tech-focused charity to receive a matching donation.

DigitalOcean Documentation
Full documentation for every DigitalOcean product.

Resources for startups and AI-native businesses
The Wave has everything you need to know about building a business, from raising funding to marketing your product.
The developer cloud
Scale up as you grow — whether you're running one virtual machine or ten thousand.

Start building today
From GPU-powered inference and Kubernetes to managed databases and storage, get everything you need to build, scale, and deploy intelligent applications.
