By Brian Storti and Matt Abrams

The author selected the Tech Education Fund to receive a donation as part of the Write for DOnations program.
Introduction
A service mesh is a dedicated infrastructure layer that helps administrators handle service-to-service communication. Offering many powerful tools, these service meshes can make your system safer, more reliable, and more visible too.
A service mesh like Linkerd, for example, can automatically encrypt connections, handle request retries and timeouts, provide telemetry information like success rates and latencies, and more.
In this tutorial, you will install the Linkerd service mesh in your Kubernetes cluster, deploy an example application, and then explore Linkerd’s dashboard. After familiarizing yourself with some of this dashboard information, you will configure Linkerd to enforce timeout and retry policies for a particular Kubernetes pod.
Alternately, consider exploring DigitalOcean’s one-click Linkerd/Kubernetes installation option.
Prerequisites
-
A Kubernetes 1.12+ cluster. In this tutorial, the setup will use a DigitalOcean Kubernetes cluster with three nodes, but you are free to create a cluster using another method.
-
The
kubectlcommand-line tool installed on a development server and configured to connect to your cluster. You can read more about installingkubectlin its official documentation.
Step 1 — Deploying the Application
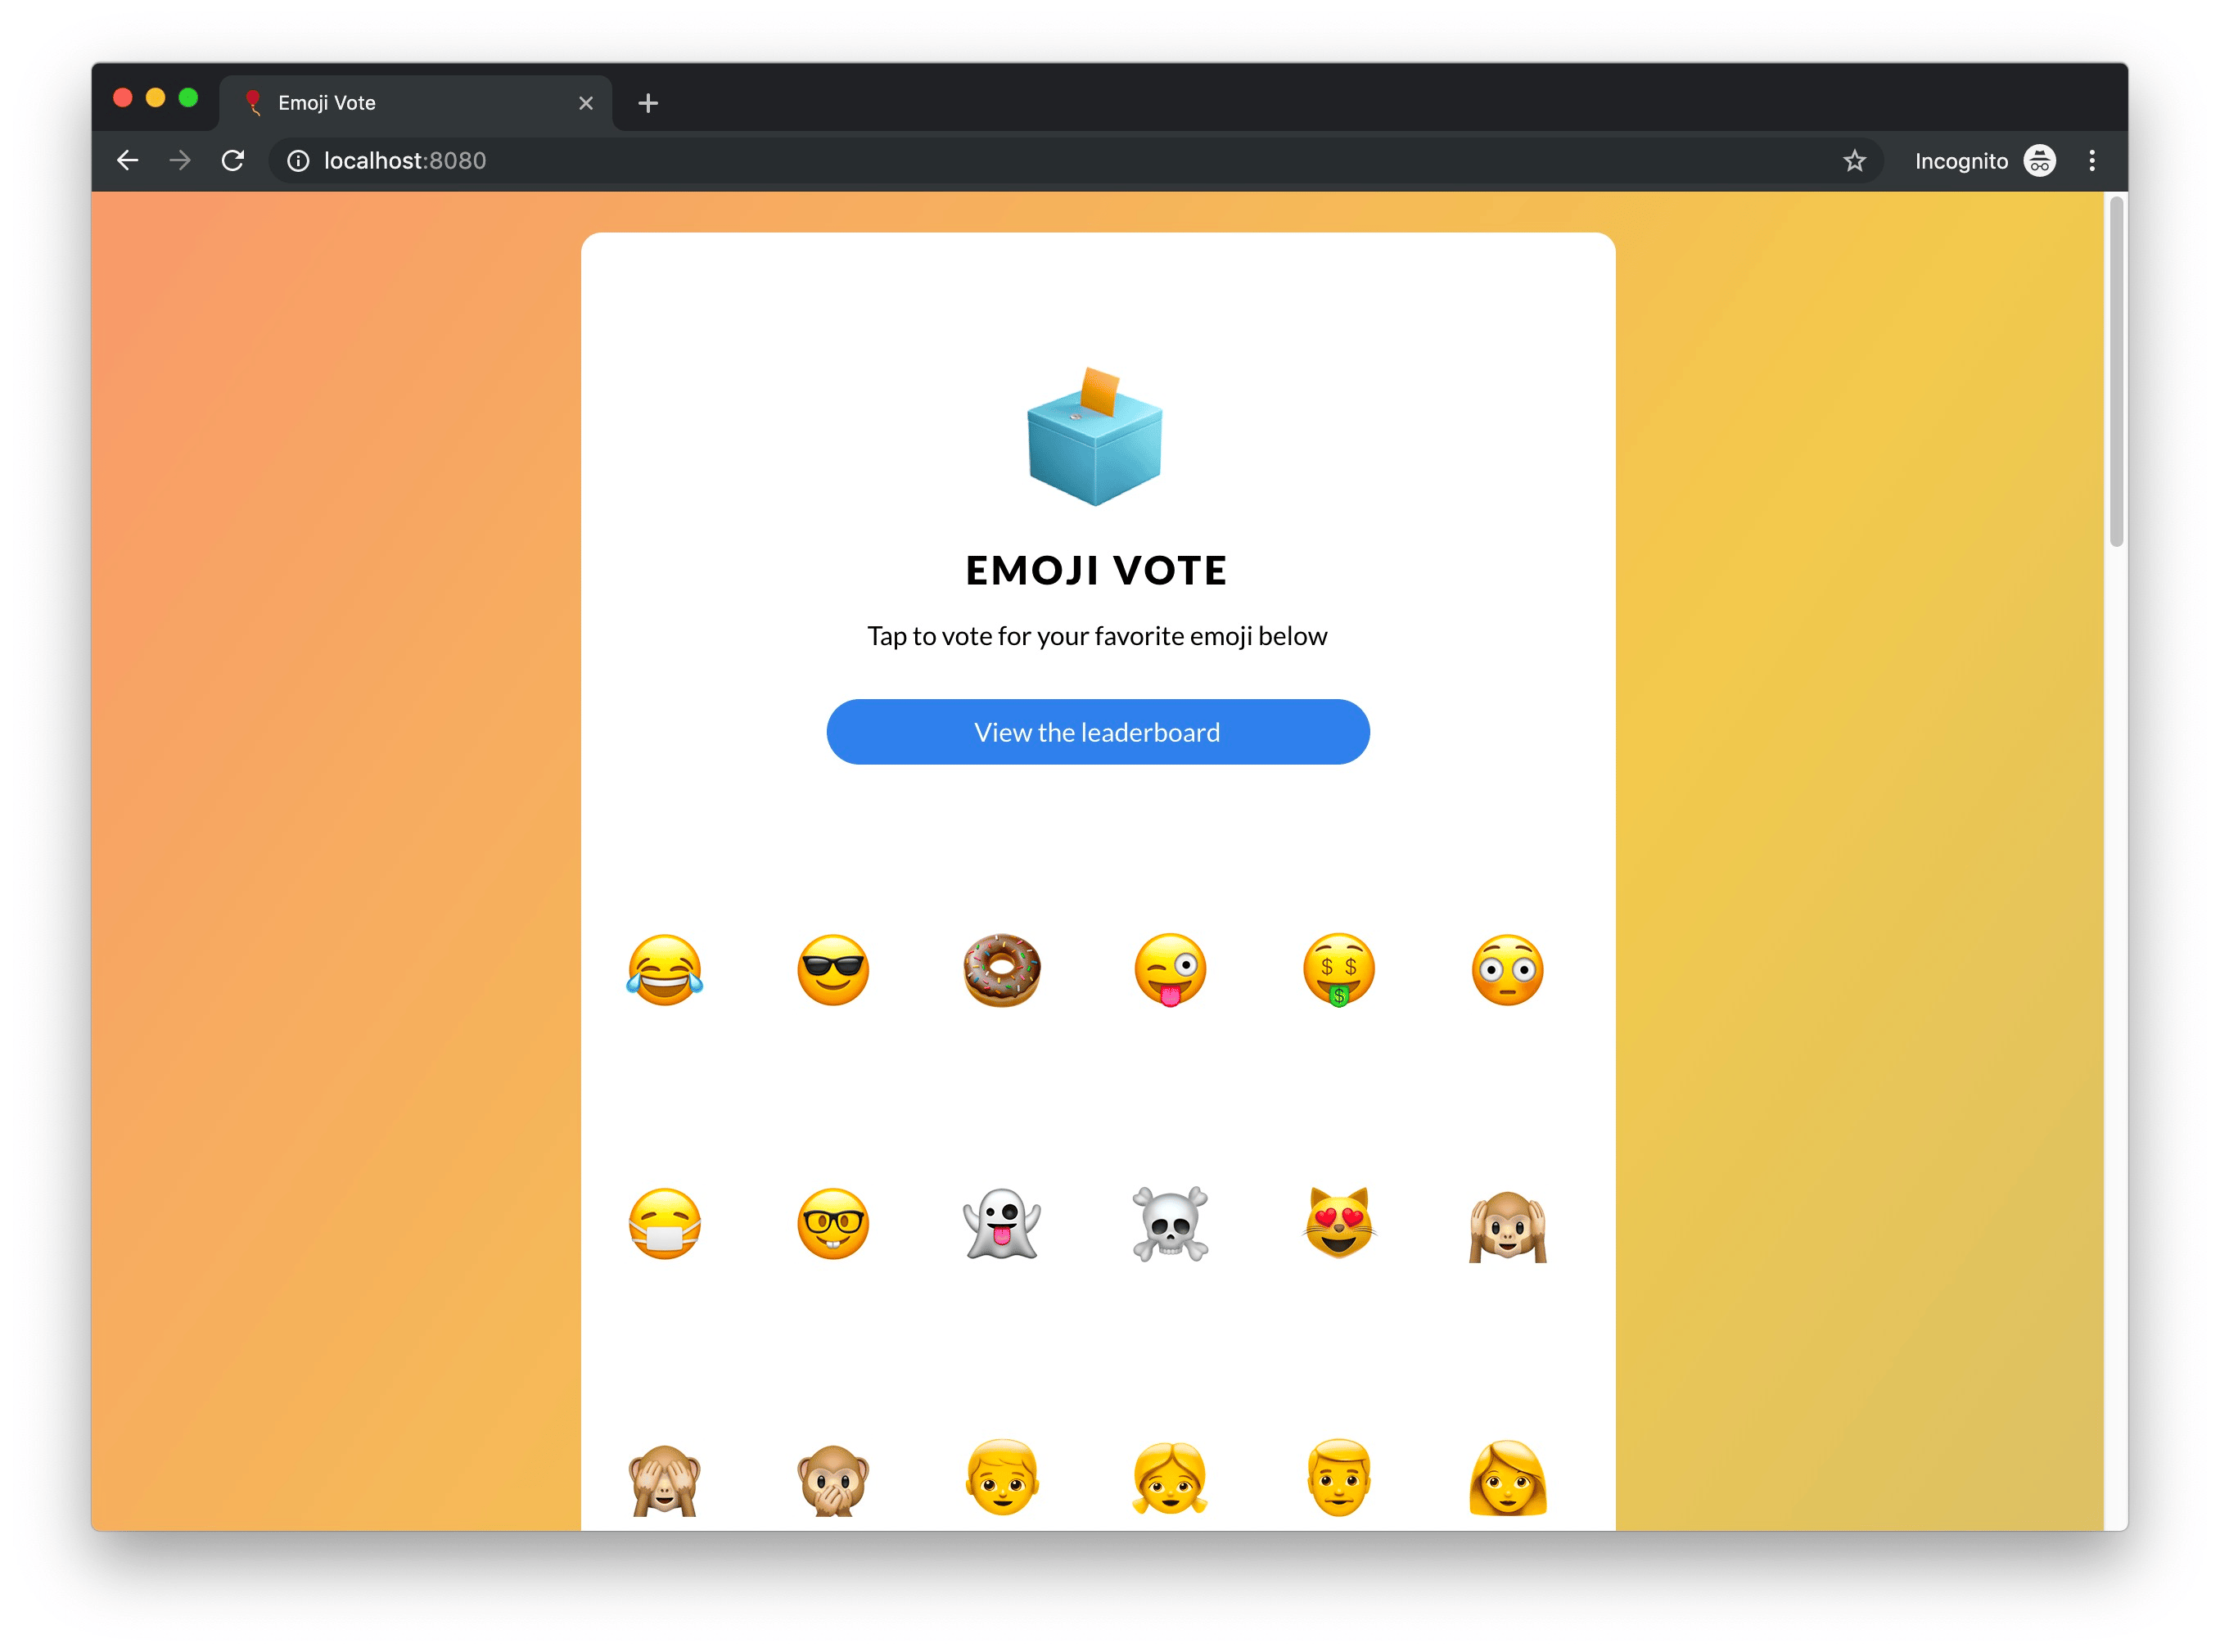
To see Linkerd in action, you need to have an application running in your cluster. In this step you will deploy an application called emojivoto, which the Linkerd team created for this purpose.
In this repository, you can see the code for the four services that compose the application, as well as the manifest file that you will use to deploy these services in your Kubernetes cluster.
First, save this manifest file locally:
- curl https://run.linkerd.io/emojivoto.yml --output manifest.yaml
You are using curl to fetch the file, then passing the --output option to tell it where you want the file saved. In this case, you are creating a file called manifest.yaml.
To better understand what this file will accomplish, inspect its contents with cat or open it with your favorite editor:
- cat manifest.yaml | less
Press SPACE to page through the directives. You will see that manifest.yaml is creating a Kubernetes namespace called emojivoto where everything related to this application will run, and a couple of Kubernetes Deployments and Services.
Next, apply this manifest in your Kubernetes cluster:
- kubectl apply -f manifest.yaml
Again, you’re using kubectl apply with the -f flag to assign a file that you want to apply.
This command will output a list of all the resources that were created:
Outputnamespace/emojivoto created
serviceaccount/emoji created
serviceaccount/voting created
serviceaccount/web created
service/emoji-svc created
service/voting-svc created
service/web-svc created
deployment.apps/emoji created
deployment.apps/vote-bot created
deployment.apps/voting created
deployment.apps/web created
Now check that the services are running:
- kubectl -n emojivoto get pods
You are using kubectl to list all the pods you have running in your cluster, and then passing the -n flag to indicate which namespaces you want to use. You’re passing the emojivoto namespace because that is where you are running all these services.
When you see all the pods in the Running state, you are good to go:
OutputNAME                        READY   STATUS    RESTARTS   AGE
emoji-566954596f-cw75b      1/1     Running   0          24s
vote-bot-85c5f5699f-7dw5c   1/1     Running   0          24s
voting-756995b6fc-czf8z     1/1     Running   0          24s
web-7f7b69d467-2546n        1/1     Running   0          23s
Finally, to see the application running in your browser, you will use the kubectl built-in feature of forwarding local requests to your remote cluster:
- kubectl -n emojivoto port-forward svc/web-svc 8080:80
Note: If you are not running this from your local machine, you will need to add the --address 0.0.0.0 flag to listen on all addresses and not only localhost.
Here you are again using kubectl in the emojivoto namespaces, but now calling the port-forward sub-command and directing it to forward all local requests on port 8080 to the Kubernetes service web-svc, on port 80. This is just a convenient way for you to access your application without needing to have a proper load balancer in place.
Now visit http://localhost:8080 and you will see the emojivoto application.
Press CTRL + C in your terminal. With an application running in your cluster, you are now ready to install Linkerd and see how it works.
Step 2 — Installing Linkerd
Now that you have an application running, let’s install Linkerd. To install it in your Kubernetes cluster, you first need the Linkerd CLI. You will use this command line interface to interact with Linkerd from your local machine. After that, you can install Linkerd in your cluster.
First, let’s install the CLI with the script provided by the Linkerd team:
- curl https://run.linkerd.io/install | sh
Here you are using curl to download the installation script, and then you are piping the output to sh, which automatically executes the script. Alternatively, you can download the CLI directly from Linkerd’s release page.
If you use the script then it will install Linkerd at ~/.linkerd2/bin. Now confirm that the CLI is working correctly:
- ~/.linkerd2/bin/linkerd version
The command will output something like this:
OutputClient version: stable-2.7.1
Server version: unavailable
Then, to make it easier to run the CLI, add this directory to your $PATH:
- export PATH=$PATH:$HOME/.linkerd2/bin
Now you can more directly run the commands, like the previous one:
- linkerd version
Finally, let’s install Linkerd in your Kubernetes cluster. The linkerd install command is used to generate all the necessary yaml manifests needed to run Linkerd, but it will not apply these manifests to your cluster. Run this command to inspect its output:
- linkerd install
You will see a long output, listing all the yaml manifests for resources Linkerd needs to run. To apply these manifests to your cluster, run:
- linkerd install | kubectl apply -f -
Running linkerd install will output all the manifests you saw previously. | then pipes this output directly to kubectl apply, which will apply them.
After you run this command, kubectl apply will output a list of all the resources that were created.
To confirm that everything is running in your cluster, run linkerd check:
- linkerd check
This will run several checks against your cluster to confirm that all the necessary components are running:
Outputkubernetes-api
--------------
√ can initialize the client
√ can query the Kubernetes API

[...]

control-plane-version
---------------------
√ control plane is up-to-date
√ control plane and cli versions match

Status check results are √
Finally, run this command to open the built-in Linkerd dashboard in your browser (remember you will need to provide the --address 0.0.0.0 flag if you are not running this from your local machine):
- linkerd dashboard
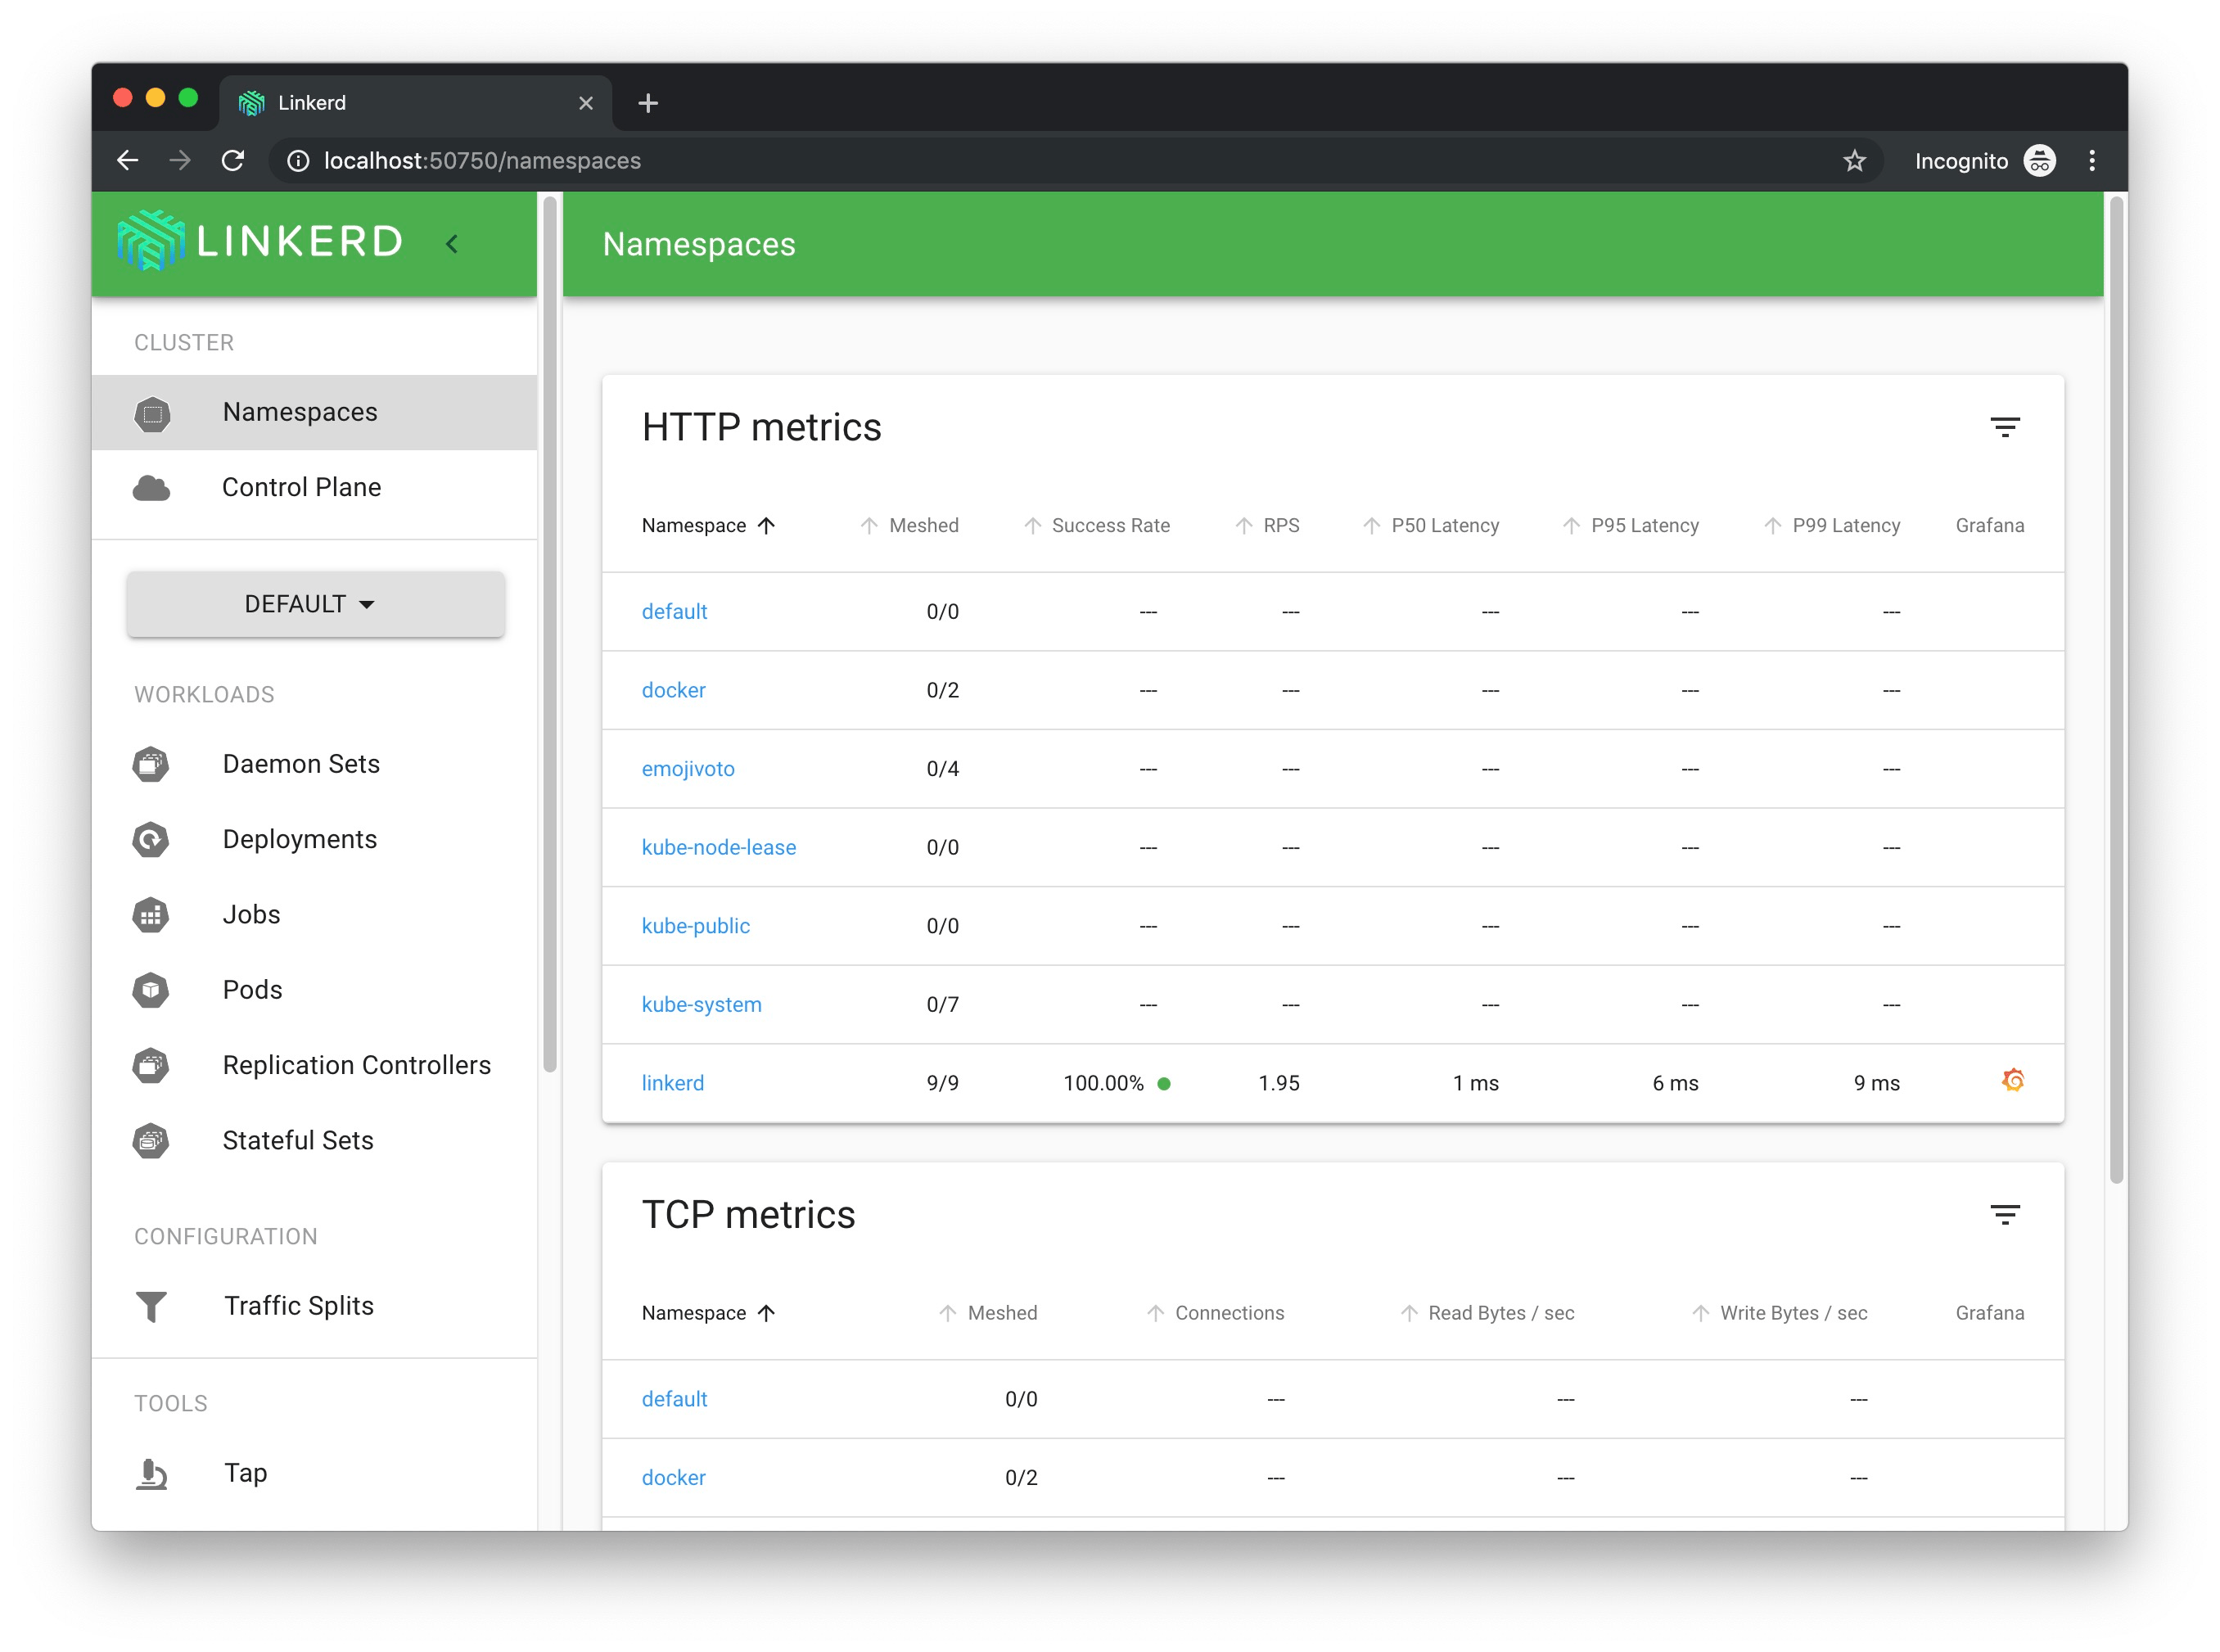
Most of the information you see in the dashboard you can obtain using the Linkerd CLI. For example, run this command to see high-level stats deployments:
- linkerd stat deployments -n linkerd
Here you are saying that you want the stats for deployments running in the linkerd namespace. These are Linkerd’s own components, and, interestingly, you can use Linkerd itself to monitor them. You can see stats like requests per second (RPS), success rate, latency, and more. You can also see a Meshed column, which indicates how many pods Linkerd has injected:
OutputNAME                     MESHED   SUCCESS      RPS   LATENCY_P50   LATENCY_P95   LATENCY_P99   TCP_CONN
linkerd-controller          1/1   100.00%   0.4rps           1ms          87ms          98ms          5
linkerd-destination         1/1   100.00%   0.3rps           1ms           2ms           2ms         13
linkerd-grafana             1/1   100.00%   0.3rps           2ms           3ms           3ms          2
linkerd-identity            1/1   100.00%   0.3rps           1ms           2ms           2ms         10
linkerd-prometheus          1/1   100.00%   0.7rps          35ms         155ms         191ms          9
linkerd-proxy-injector      1/1   100.00%   0.3rps           2ms           3ms           3ms          2
linkerd-sp-validator        1/1   100.00%   0.3rps           1ms           5ms           5ms          2
linkerd-tap                 1/1   100.00%   0.3rps           1ms           4ms           4ms          6
linkerd-web                 1/1   100.00%   0.3rps           1ms           2ms           2ms          2
Now try this command in your emojivoto namespace:
- linkerd stat deployments -n emojivoto
Even though you can see your four services, none of the stats you saw before are available for these deployments, and in the “Meshed” column you can see that it says 0/1:
OutputNAME       MESHED   SUCCESS   RPS   LATENCY_P50   LATENCY_P95   LATENCY_P99   TCP_CONN
emoji         0/1         -     -             -             -             -          -
vote-bot      0/1         -     -             -             -             -          -
voting        0/1         -     -             -             -             -          -
web           0/1         -     -             -             -             -          -
The output here means that you still have not injected Linkerd into the application. This will be your next step.
Step 3 — Injecting Linkerd into Your Application
Now that you have Linkerd running in your cluster, you are ready to inject it into your emojivoto application.
Linkerd works by running a sidecar container in your Kubernetes pods. That is, you will inject a linkerd proxy container into every pod you have running. Every request that your pods then send or receive will go through this very lightweight proxy that can gather metrics (like success rate, requests per second, and latency) and enforce policies (like timeouts and retries).
You can manually inject Linkerd’s proxy with this command:
- kubectl get deployments -n emojivoto -o yaml | linkerd inject - | kubectl apply -f -
In this command, you are first using kubectl get to get all the Kubernetes deployments you have running in the emojivoto namespace, and then specifying that you want the output in the yaml format. Then you are sending that output to the linkerd inject command. This command will read the yaml file with the current manifests you have running and modify it to include the linkerd proxy alongside every deployment.
Lastly, you are receiving this modified manifest and applying it to your cluster with kubectl apply.
After running this command you will see a message saying that all four emojivoto services (emoji, vote-bot, voting, and web) were successfully injected.
If you now retrieve stats for emojivoto, you will see that all your deployments are now meshed, and after a few seconds you will start to see the same stats that you saw for the linkerd namespace:
- linkerd stat deployments -n emojivoto
Here you can see the stats for all the four services that compose the emojivoto application, with their respective success rate, requests per second and latency, without having to write or change any application code.
OutputNAME       MESHED   SUCCESS      RPS   LATENCY_P50   LATENCY_P95   LATENCY_P99   TCP_CONN
emoji         1/1   100.00%   1.9rps           1ms           2ms           2ms          2
vote-bot      1/1         -        -             -             -             -          -
voting        1/1    85.96%   0.9rps           1ms           1ms           1ms          2
web           1/1    93.04%   1.9rps           8ms          27ms          29ms          2
The vote-bot service doesn’t show any stats because it is just a bot that sends requests to other services and therefore is not receiving any traffic, which is in itself valuable information.
Now let’s see how you can provide some extra information to Linkerd about your services to customize their behavior.
Step 4 — Defining a Service Profile
Now that you have injected Linkerd into your application, you can begin to retrieve valuable information about how each of your services is behaving. Moreover, you have accomplished this without needing to write any custom configurations or change your application’s code. However, if you do provide Linkerd with some additional information, it can then enforce numerous policies, like timeouts and retries. It can also then provide per-route metrics.
This information is provided through a Service Profile, which is a custom Linkerd resource where you can describe the routes in your applications and how each one will behave.
Here’s an example of what a Service Profile manifest looks like:
apiVersion: linkerd.io/v1alpha2
kind: ServiceProfile
metadata:
  name: my-service.my-namespace.svc.cluster.local
spec:
  routes:
  - name: My Route Name
    isRetryable: true # Define it's safe to retry this route
    timeout: 100ms # Define a timeout for this route
    condition:
      method: GET
      pathRegex: /my/route/path
The Service Profile describes a list of routes, and then defines how requests that match the specified condition will behave. In this example, you are saying that every GET request sent to /my/route/path will timeout after 100ms, and, if they fail, they can be retried.
Let’s now create a Service Profile for one of your services. Taking voting-svc as an example, first use the Linkerd CLI to check the routes you have defined for this service:
- linkerd routes svc/voting-svc -n emojivoto
Here you are using the linkerd routes command to list all the routes for the service voting-svc, in the emojiovoto namespace:
OutputROUTE          SERVICE   SUCCESS      RPS   LATENCY_P50   LATENCY_P95   LATENCY_P99
[DEFAULT]   voting-svc    83.05%   1.0rps           1ms           1ms           2ms
You will find only one route, [DEFAULT]. This is where all requests are grouped until you define your Service Profile.
Now open nano or your favorite editor to create a service-profile.yaml file:
- nano service-profile.yaml
Add the following Service Profile definition into this file:
apiVersion: linkerd.io/v1alpha2
kind: ServiceProfile
metadata:
  name: voting-svc.emojivoto.svc.cluster.local
  namespace: emojivoto
spec:
  routes:
  - name: VoteDoughnut
    isRetryable: true
    timeout: 100ms
    condition:
      method: POST
      pathRegex: /emojivoto.v1.VotingService/VoteDoughnut
Now save the file and close your editor.
Here you are declaring a Service Profile for the voting-svc service, in the emojivoto namespace. You have defined one route, called VoteDoughnut, which will match any POST request to the /emojivoto.v1.VotingService/VoteDoughnut path. If a request matching these criteria takes more than 100ms, Linkerd will cancel it and the client will receive a 504 response back. You are also telling Linkerd that if this request fails it can be retried.
Now apply this file to your cluster:
- kubectl apply -f service-profile.yaml
After a few seconds, recheck the routes for this service:
- linkerd routes svc/voting-svc -n emojivoto
You will now see your newly defined VoteDoughnut route:
OutputROUTE             SERVICE   SUCCESS      RPS   LATENCY_P50   LATENCY_P95   LATENCY_P99
VoteDoughnut   voting-svc     0.00%   0.2rps           1ms           1ms           1ms
[DEFAULT]      voting-svc   100.00%   0.8rps           1ms           4ms           4ms
You can see several custom metrics, like success rate, requests per second, and latency for this specific route. Note that the VoteDoughnut endpoint is intentionally configured to always return an error, and that it is outputting a success rate of 0%, while the [DEFAULT] route is outputting 100%.
So now, after giving Linkerd a little bit of information about your service, you have custom metrics per route, as well as two policies enforced: timeouts and retries.
Conclusion
In this article, you installed Linkerd in your Kubernetes cluster and used it to monitor a sample application. You extracted useful telemetry information like success rate, throughput, and latency. You also configured a Linkerd Service Profile to collect per-route metrics and enforce two policies in the emojivoto application.
If you are interested in learning more about Linkerd, you can browse their great documentation page, where they show how to secure your services, configure distributed tracing, automate canary releases, and much more.
From here you might also consider checking out Istio, which is another Service Mesh with a different set of features and trade-offs.
Thanks for learning with the DigitalOcean Community. Check out our offerings for compute, storage, networking, and managed databases.
About the author(s)
Supporting the open-source community one tutorial at a time. Former Technical Editor at DigitalOcean. Expertise in topics including Ubuntu 22.04, Ubuntu 20.04, CentOS, and more.
Still looking for an answer?
This textbox defaults to using Markdown to format your answer.
You can type !ref in this text area to quickly search our full set of tutorials, documentation & marketplace offerings and insert the link!
 This work is licensed under a Creative Commons Attribution-NonCommercial- ShareAlike 4.0 International License.
Become a contributor for community
Get paid to write technical tutorials and select a tech-focused charity to receive a matching donation.

DigitalOcean Documentation
Full documentation for every DigitalOcean product.

Resources for startups and AI-native businesses
The Wave has everything you need to know about building a business, from raising funding to marketing your product.
The developer cloud
Scale up as you grow — whether you're running one virtual machine or ten thousand.

Start building today
From GPU-powered inference and Kubernetes to managed databases and storage, get everything you need to build, scale, and deploy intelligent applications.
