By Vadym Kalsin and Sharon Campbell

Introduction
Monitoring systems receive and accumulate large amounts of data as they run. The longer a monitoring system runs, the more data it collects.
Most monitoring systems do not have the tools for long-term data analysis and storage. They’ll either keep every reading, which causes storage issues, or remove old data upon reaching a certain threshold, which prevents us from analyzing our system performance over a long period of time.
Some monitoring systems, such as Zabbix, give the ability to store both exact and averaged data values, but their customization capabilities are very limited.
Time series databases help us solve the problem of storing large amounts of historical data. A time series is just a sequence of data points over time, and a time series database is optimized to store this type of data.
In this tutorial we will show you how to install and configure Graphite - a tool for storing numeric time-series data and rendering graphs of this data. It consists of three software components:
- Carbon - a daemon that listens for time-series data and writes to disk using a storage backend
- Whisper - a simple database similar to RRDTool for storing time-series data
- Graphite-Web - a Django web application that renders graphs and provides a feature-rich visualization and analysis of the obtained data
In our final configuration, our monitoring agent sends data points to Carbon, which has the carbon-relay, carbon-aggregator, and carbon-cache components. Carbon writes the data to a Whisper database. Graphite-Web displays the data on a web page, which can be viewed by users.
Prerequisites
Before you get started, make sure you’ve completed these steps:
- Deploy a CentOS 7 Droplet
- Add a sudo user by following the Initial Server Setup
- Add swap space to your server; the example 4 GB amount is fine
- Enable the EPEL (Extra Packages for Enterprise Linux) repository:
sudo yum -y install epel-release
Update your system:
sudo yum -y update
More information about the EPEL repository is available on fedoraproject.org.
Step 1 — Installing Graphite and Carbon
Install the required applications, including Python-related tools and the Apache web server:
sudo yum install httpd mod_wsgi python-pip python-devel git pycairo libffi-devel
Get the latest source files for Graphite and Carbon from the GitHub:
cd /usr/local/src
sudo git clone https://github.com/graphite-project/graphite-web.git
sudo git clone https://github.com/graphite-project/carbon.git
Check the requirements:
python /usr/local/src/graphite-web/check-dependencies.py
You will see the following messages:
[REQUIRED] Unable to import the 'whisper' or 'ceres' modules, please download this package from the Graphite project page and install it.

	. . .

	6 optional dependencies not met. Please consider the optional items before proceeding.
	5 necessary dependencies not met. Graphite will not function until these dependencies are fulfilled.
So you have to install missing modules. First install gcc:
sudo yum install gcc
Then install the modules:
sudo pip install -r /usr/local/src/graphite-web/requirements.txt
Then check the version of the django-tagging package:
pip show django-tagging
If the version of the package is less than 0.3.4, then you should update it:
sudo pip install -U django-tagging
Check the requirements again:
python /usr/local/src/graphite-web/check-dependencies.py
Now you should see the following output:
[OPTIONAL] Unable to import the 'ldap' module, do you have python-ldap installed for python 2.7.5? Without python-ldap, you will not be able to use LDAP authentication in the graphite webapp.
[OPTIONAL] Unable to import the 'python-rrdtool' module, this is required for reading RRD.
2 optional dependencies not met. Please consider the optional items before proceeding.
All necessary dependencies are met.
We won’t need LDAP authentication or the RRD database in this tutorial.
Install Carbon:
cd /usr/local/src/carbon/
sudo python setup.py install
Install the web application:
cd /usr/local/src/graphite-web/
sudo python setup.py install
Now all components are installed and you are ready to configure Graphite.
Graphite includes several sample configuration files. All you need is to copy and edit them as shown in the next step.
Step 2 — Configuring Carbon
Carbon includes several services:
carbon-cache- accepts metrics and writes them to diskcarbon-relay- replicates datacarbon-aggregator- runs in front ofcarbon-cacheto buffer metrics over time before forwarding them into Whisper
The last two are optional.
Carbon Configuration File
The main config file is carbon.conf. It defines the settings for each Carbon daemon.
Let’s make a copy of the example file:
sudo cp /opt/graphite/conf/carbon.conf.example /opt/graphite/conf/carbon.conf
Each setting within this file is documented via informative comments in the file itself. You can examine them, but for our tutorial, the default settings are suitable.
Storage Schemas
Next, you will need to edit the storage-schemas.conf file which describes retention rates for storing metrics. It matches metric paths to patterns, and tells Whisper what frequency and history of datapoints to store.
The size of the disk space occupied by data depends on the settings in this file.
First, make a copy of the example file:
sudo cp /opt/graphite/conf/storage-schemas.conf.example /opt/graphite/conf/storage-schemas.conf
Let’s open the file for editing:
sudo vi /opt/graphite/conf/storage-schemas.conf
By default, it contains two sections:
[carbon]
pattern = ^carbon\.
retentions = 60:90d

[default_1min_for_1day]
pattern = .*
retentions = 60s:1d
Each section has:
- a name, specified inside square brackets
- a regular expression, specified after
pattern= - a retention rate line, specified after
retentions=
For example, let’s add a new section:
[zabbix_server]
pattern = ^Zabbix_server\.
retentions = 30s:7d,5m:30d,10m:1y
The regular expression pattern will match any metric that starts with Zabbix_server. Additionally, this example uses multiple retentions:
- each data point represents 30 seconds and we want to keep up to 7 days of data with such frequency
- all historical data for the last 30 days is stored in 5 minute intervals
- all historical data for the last year is stored in 10 minute intervals
Whisper will downsample metrics as thresholds for retention are exceeded.
Note: The sections are applied in order from the top to bottom and the first pattern that matches the metric name is used!
Storage Aggregation (Optional)
Next, you may need the storage-aggregation.conf file which defines how to aggregate data to lower-precision retentions. This file is optional. If it is not present, defaults will be used.
Make a copy of the example file:
sudo cp /opt/graphite/conf/storage-aggregation.conf.example /opt/graphite/conf/storage-aggregation.conf
Let’s take a look at the file:
sudo vi /opt/graphite/conf/storage-aggregation.conf
By default, it contains 4 sections:
[min]
pattern = \.min$
xFilesFactor = 0.1
aggregationMethod = min

[max]
pattern = \.max$
xFilesFactor = 0.1
aggregationMethod = max

[sum]
pattern = \.count$
xFilesFactor = 0
aggregationMethod = sum

[default_average]
pattern = .*
xFilesFactor = 0.5
aggregationMethod = average
Similar to the storage-schemas.conf file, each section has a name specified inside square brackets, and a regular expression specified after pattern=. Each section also has two additional parameters:
xFilesFactorspecifies what fraction of the previous retention level’s slots must have non-null values in order to aggregate to a non-null value. The default is0.5aggregationMethodspecifies the function (average,sum,min,max,last) used to aggregate values for the next retention level. The default isaverage
By default, as the data hits the next retention interval, Graphite will sum all metrics ending with .count, get the minimum/maximum of all metrics ending with .min/.max respectively, and average everything else.
Relay (Optional)
carbon-relay is used for replication and sharding. carbon-relay can run together with (or instead of) carbon-cache and relay incoming metrics to multiple backend carbon-caches running on different ports or hosts.
To configure data transfer to other hosts, you must edit the corresponding configuration file. First, make a copy of the example file:
sudo cp /opt/graphite/conf/relay-rules.conf.example /opt/graphite/conf/relay-rules.conf
Open the file for editing:
sudo vi /opt/graphite/conf/relay-rules.conf
By default, it contains a single section, which sends the data to localhost:
[default]
default = true
destinations = 127.0.0.1:2004:a, 127.0.0.1:2104:b
(:a and :b means that on the same host you can run multiple instances of carbon-cache)
The example below shows the carbon-relay settings to send data from Zabbix_server to one host, and all other data to three other hosts:
[zabbix]
pattern = ^Zabbix_server\.
destinations = 10.0.0.4:2004

[default]
default = true
destinations = 127.0.0.1:2004, 10.0.0.2:2024, 10.0.0.3:2004
The regular expression pattern in first section will match any metric that starts with Zabbix_server and all data will be transmitted to the host with IP address 10.0.0.4. All other data will be transmitted to localhost and two other hosts.
All destinations listed in relay-rules.conf must also be listed in the /opt/graphite/conf/carbon.conf file, in the DESTINATIONS setting in the [relay] section:
sudo vi /opt/graphite/conf/carbon.conf
We’ve added three new IPs:
[relay]
...
DESTINATIONS = 127.0.0.1:2004, 10.0.0.2:2024, 10.0.0.3:2004, 10.0.0.4:2004
...
Aggregation (Optional)
carbon-aggregator is used to buffer metrics over time before reporting them to the Whisper database. It can be run in front of carbon-cache. Aggregation rules allow you to add several metrics together, reducing the need to summarize many metrics in every URL.
To configure the data aggregation, first copy the example file:
sudo cp /opt/graphite/conf/aggregation-rules.conf.example /opt/graphite/conf/aggregation-rules.conf
The form of each line in this file should be as follows:
output_template (frequency) = method input_pattern
This will capture any received metrics that match input_pattern for calculating an aggregate metric. The calculation will occur every frequency seconds. Available aggregation methods are: sum or avg. The name of the aggregate metric will be derived from output_template filling in any captured fields from input_pattern.
For example, let’s imagine that your organization has 25 branch offices, and you want to build the graph of their total internet traffic.
- collectd.monitoring-host.branch-01.if_octets.rx
- collectd.monitoring-host.branch-02.if_octets.rx
- collectd.monitoring-host.branch-03.if_octets.rx
- …
- collectd.monitoring-host.branch-25.if_octets.rx
You can store the data from each branch office, build the graph for each of them and then sum them.
However, this type of operation is expensive: in order to render the summary graph you first need to read the 25 different metrics, then you need to combine the results by applying the summation function, and finally build the graph.
If you are only interested in the total traffic, you can precompute the values. To do this, you can define a rule that matches metrics on a regular expression, buffers them for a specified amount of time, applies a function on the buffered data, and stores the result in a separate metric. So the configuration will be as follows:
collectd.monitoring-host.branches.if_octets.rx (60) = sum collectd.monitoring-host.*.if_octets.rx
Given this configuration, metrics will be buffered for 60 seconds, combined using the sum function, and stored to the new metric file.
Step 3 — Starting Carbon as a Service
Configure Carbon’s init scripts.
First, copy them to the /etc/init.d/ and make them executable:
sudo cp /usr/local/src/carbon/distro/redhat/init.d/carbon-* /etc/init.d/
sudo chmod +x /etc/init.d/carbon-*
Start carbon-cache:
sudo systemctl start carbon-cache
If you chose to use them, start carbon-relay and carbon-aggregator:
sudo systemctl start carbon-relay
sudo systemctl start carbon-aggregator
The configuration of Carbon is finished: Carbon is running and ready to receive the data. You can now configure the web interface.
Step 4 — Configuring the Graphite-Web Application
Graphite-Web is the Django web application that runs under Apache/mod_wsgi.
Copy the example settings file:
sudo cp /opt/graphite/webapp/graphite/local_settings.py.example /opt/graphite/webapp/graphite/local_settings.py
Open the file for editing:
sudo vi /opt/graphite/webapp/graphite/local_settings.py
Locate the SECRET_KEY and enter a unique value. This is used to provide cryptographic signing; you can put anything here as long as it’s unique. Locate the TIME_ZONE update it to the time zone for the installation. See the list of time zones if needed.
. . .

SECRET_KEY = 'enter_your_unique_secret_key_here'

. . .

TIME_ZONE = 'America/Chicago'

. . .
Initialize a new database:
cd /opt/graphite
sudo PYTHONPATH=/opt/graphite/webapp/ django-admin.py syncdb --settings=graphite.settings
You will see the following output. The prompt will ask you some questions to create a superuser account for the database:
	Operations to perform:
      Synchronize unmigrated apps: url_shortener, account, dashboard, tagging, events
      Apply all migrations: admin, contenttypes, auth, sessions
    Synchronizing apps without migrations:
      Creating tables...
        Creating table account_profile

      . . .

      Applying sessions.0001_initial... OK

    You have installed Django's auth system, and don't have any superusers defined.
    Would you like to create one now? (yes/no): yes
    Username (leave blank to use 'root'): root
    Email address: sammy@example.com
    Password: password
    Password (again): password
    Superuser created successfully.
Run the following command to collect all static files in a single directory:
sudo PYTHONPATH=/opt/graphite/webapp/ django-admin.py collectstatic --settings=graphite.settings
You will see the following output. Answer yes when prompted:
You have requested to collect static files at the destination
location as specified in your settings:

/opt/graphite/static

This will overwrite existing files!
Are you sure you want to do this?

Type 'yes' to continue, or 'no' to cancel: yes
Copying '/opt/graphite/webapp/content/js/browser.js'
Copying '/opt/graphite/webapp/content/js/completer.js'
...
407 static files copied to '/opt/graphite/static'.
Make the appropriate Graphite owned by the apache user:
sudo chown -R apache:apache /opt/graphite/storage/
sudo chown -R apache:apache /opt/graphite/static/
sudo chown -R apache:apache /opt/graphite/webapp/
To run the web application you need the graphite.wsgi file. This file contains the code mod_wsgi is executing on startup to get the application object. Copy the example file:
sudo cp /opt/graphite/conf/graphite.wsgi.example /opt/graphite/conf/graphite.wsgi
Configure Apache. To learn more about Apache virtual hosts in general, see this tutorial. Copy the example virtual host file from Graphite:
sudo cp /opt/graphite/examples/example-graphite-vhost.conf /etc/httpd/conf.d/graphite.conf
Open the file for editing:
sudo vi /etc/httpd/conf.d/graphite.conf
Make sure your ServerName is set to your domain or IP address. The Alias line should be set correctly already. Add the <Directory> block below it.
. . .

ServerName your_server_ip

. . .

Alias /static/ /opt/graphite/static/

<Directory /opt/graphite/static/>
   Require all granted
</Directory>
Save and close the file.
Step 5 — Password-Protecting Graphite (Recommended)
By default, anyone who knows the address of the server running the web application can view any data. To prevent this you can set password access.
Create a new folder and set the permissions:
sudo mkdir /opt/graphite/secure
sudo chown -R apache:apache /opt/graphite/secure
Use htpasswd to create a new username and password that will restrict access to the Graphite-Web application. In the example below you can see how to create the user sammy and add a new password:
sudo htpasswd -c /opt/graphite/secure/.passwd sammy
New password: password
Re-type new password: password
Adding password for user sammy
Configure Apache. In the Require user line, you must specify the same name as in the previous step:
sudo vi /etc/httpd/conf.d/graphite.conf
Add this new <Location> block anywhere in the main virtual host block:
<Location "/">
     AuthType Basic
     AuthName "Private Area"
     AuthUserFile /opt/graphite/secure/.passwd
     Require user sammy
</Location>
Save and close the file.
Step 6 — Running Graphite-Web
Start the Apache service and include it to start at boot:
sudo systemctl start httpd
sudo systemctl enable httpd
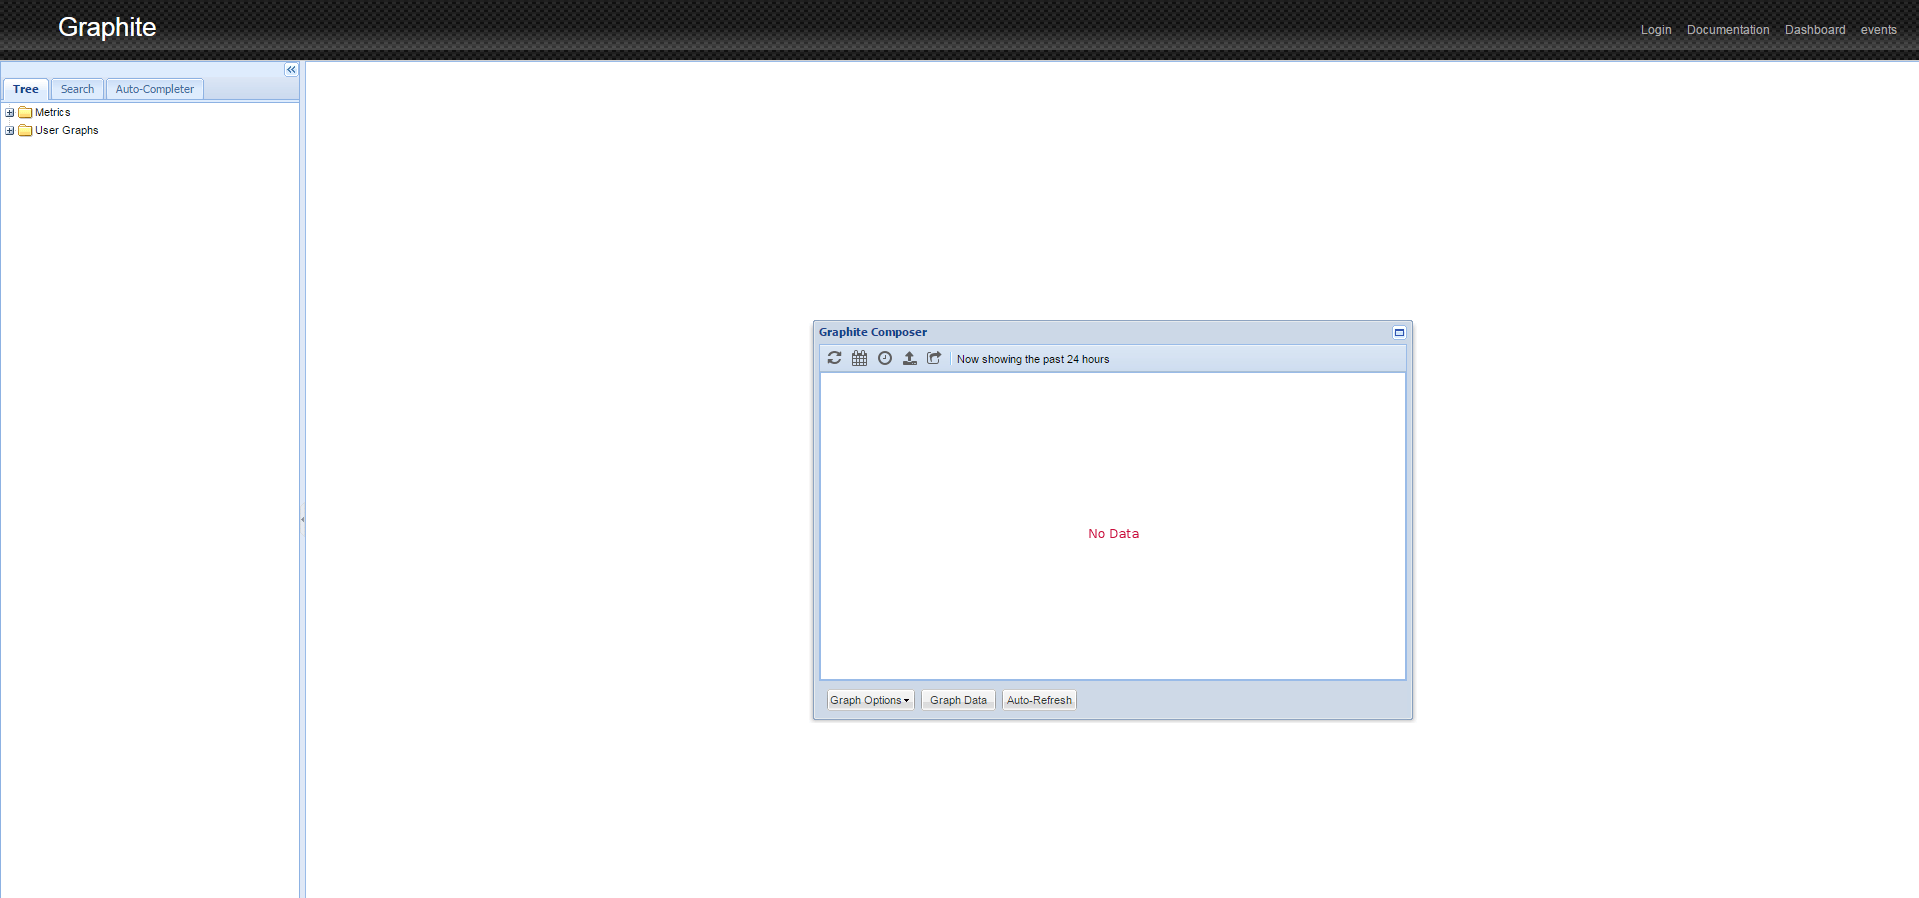
The installation is complete! Launch your browser and go to the address http://your_server_ip/.
Enter the username and password that you set in Step 5.
You will see the following:
Step 7 — Publishing Metrics from collectd
Graphite can use data from many different monitoring services. In this example, we will use collectd. It’s a daemon which periodically collects system performance statistics and provides mechanisms to store or send the values in a variety of ways.
More information about collectd is available at the official site.
Install collectd:
sudo yum install collectd
The configuration file contains many settings. Open the file for editing:
sudo vi /etc/collectd.conf
Complete the following:
- Set the
Hostnamein the Global settings. This can be any name you want and will be used in the web interface to designate this host.
Hostname "Monitor"
- Uncomment the
write_graphiteplugin settings
LoadPlugin write_graphite
- Edit the settings in the
<Plugin write_graphite>block to the following:
<Plugin write_graphite>
  <Node "localhost">
    Host "localhost"
    Port "2003"
  Protocol "tcp"
 LogSendErrors true
  Prefix "collectd."
	# Postfix "collectd"
  StoreRates true
   AlwaysAppendDS false
  EscapeCharacter "_"
  </Node>
</Plugin>
The main parameters of the write_graphite plugin:
Host(required) — the hostname of the Carbon collection agent. In our case it’s working on the localhostPort(required) — the port used by the Carbon collect agent. In our example,carbon-relaylistens on port2003Prefix— the prefix string prepended to the hostname that is sent to Carbon. We’ve added the point so Graphite can automatically group the hostsPostfix— the postfix string prepended to the hostname that is sent to Carbon. We do not need this option because we set the prefix, so you may disable it
Start collect to start sending metrics to Graphite:
sudo systemctl start collectd.service
Note: To troubleshoot, check the status of ollectd status with the command sudo systemctl status collectd.service. This will show you if it’s having any trouble writing to Graphite.
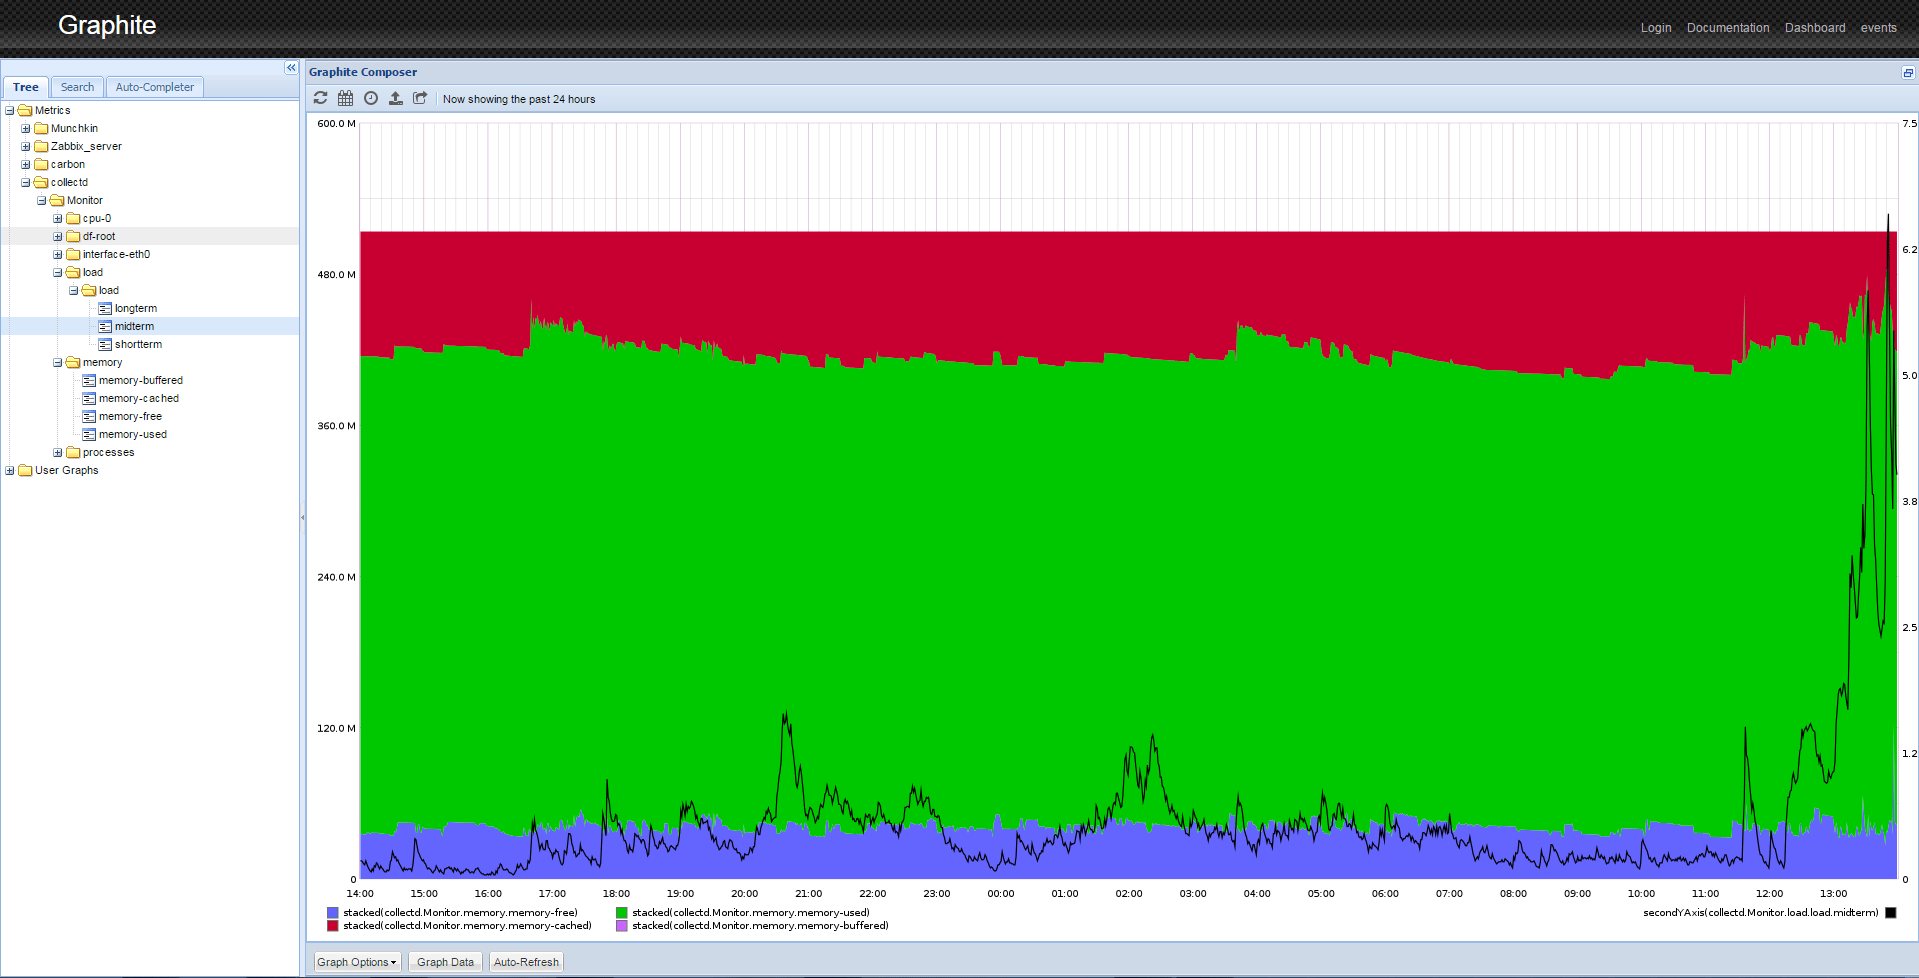
Collectd immediately begins to send data to the Graphite. Refresh the web page. If you expand the Metrics folder, you should see collectd listed. After some time, you will be able to see the pretty graphs of your data as shown below.
Step 8 — Manipulating Data
Graphite has sophisticated data display options. For example, to obtain an image similar to one shown in the image above, you need to perform several actions.
- From the left panel, click Metrics > collectd > Monitor (or the
Hostnameyou configured in Step 7) > load > load > midterm. You will see the graph of the load average.
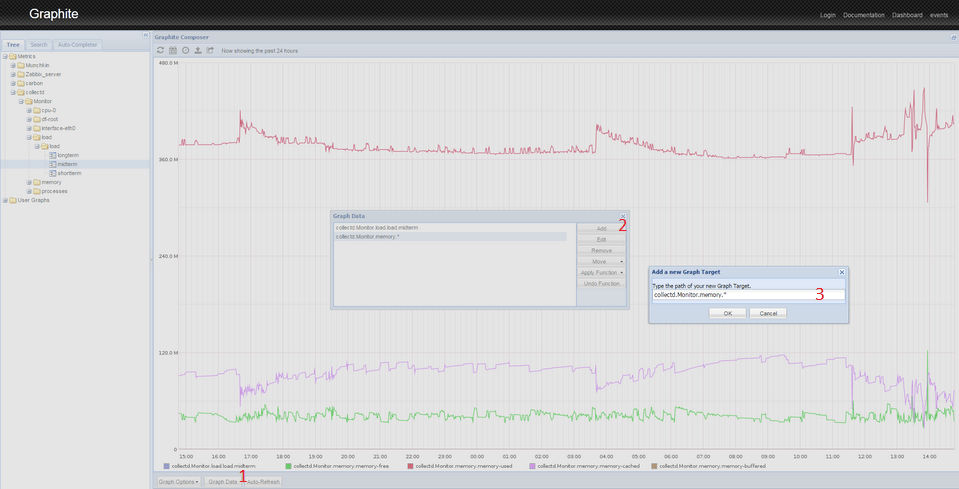
- Click the Graph Data button below the graph.
- Click the Add button on the right of the popup.
- Paste the following line:
collectd.Monitor.memory.*. This will select all of the memory-related graphs. If you used a different name for your host, use that name instead ofMonitor. - Press OK. You will see several graphs on a single screen. Because of differences in scale, the load curve turned into a line. To fix this, you must perform the following manipulations with the graphs.
- Click the Graph Data button again.
- Select the
collectd.Monitor.load.load.midtermline. - Click the Apply Function button.
- Select Special > Draw in Second Y Axis
- Click Apply Function again.
- Select Special > Color.
- Enter
blackand press OK. - Select the
collectd.Monitor.memory.*line. - Click Apply Function.
- Select Special > Draw Stacked.
- You will see the image similar to one shown at the end of Step 7.
This is just one way to display the data from your server. You can mix and combine different data on the same graph, apply different functions, scale data, calculate moving averages, forecast data, and so on.
Conclusion
Graphite is a powerful tool for storing and analyzing time series data. After completing this tutorial you should have a general understanding of how to install it, do basic setup, get your data into it, and manipulate the accumulated data.
Graphite can be used as dashboard. You can monitor key indicators: CPU utilization, memory usage, utilization of network interfaces, and so on.
Graphite has many functions for data analysis. You can use those functions to transform, combine, and perform computations on series data. Most functions can be applied sequentially. For example, you can summarize incoming traffic from all branch offices, and than compare it to the sum of outgoing traffic. Or you can summarize all incoming and outgoing traffic from all branch offices, build a summary graph over a long period of time, and see the trend for future capacity planning.
Thanks for learning with the DigitalOcean Community. Check out our offerings for compute, storage, networking, and managed databases.
About the author(s)
Monitoring engineer
Current fan and former Editorial Manager at DigitalOcean. Hi! Expertise in areas including Ubuntu, Docker, Rails, and more.
Still looking for an answer?
This textbox defaults to using Markdown to format your answer.
You can type !ref in this text area to quickly search our full set of tutorials, documentation & marketplace offerings and insert the link!
I am running into an error at this point from a fresh CentOS 7 install…
Initialize a new database:
cd /opt/graphite sudo PYTHONPATH=/opt/graphite/webapp/ django-admin.py syncdb --settings=graphite.settings
I am getting this output: Unknown command: ‘syncdb’ Type ‘django-admin.py help’ for usage.
When I type ‘django-admin.py help’:
Type ‘django-admin.py help <subcommand>’ for help on a specific subcommand.
Available subcommands:
[django] check compilemessages createcachetable dbshell diffsettings dumpdata flush inspectdb loaddata makemessages makemigrations migrate runserver sendtestemail shell showmigrations sqlflush sqlmigrate sqlsequencereset squashmigrations startapp startproject test testserver Note that only Django core commands are listed as settings are not properly configured (error: Requested setting INSTALLED_APPS, but settings are not configured. You must either define the environment variable DJANGO_SETTINGS_MODULE or call settings.configure() before accessing settings.).
Any idea what the issue may be? I followed every step exactly like they are listed. Thanks!
For all with the same problem like socalal: With Django 1.9 there were things changed internally in Django.
As new command which I found in the Graphite Bugs, i ran this one: PYTHONPATH=/opt/graphite/webapp django-admin.py migrate --settings=graphite.settings --run-syncdb
Github Issue: https://github.com/graphite-project/graphite-web/issues/1425
I am facing issue with below command
PYTHONPATH=/opt/graphite/webapp/ django-admin.py syncdb --settings=graphite.settings
As suggested by TheBigfoot I am use need command as below
PYTHONPATH=/opt/graphite/webapp django-admin.py migrate --settings=graphite.settings --run-syncdb
But above command not creating database to login graphite dashboard. If I downgrade Django then I am getting Internal error when I access graphite link. Please advise.
Hi Guys,
I have configured Graphite on Centos 7 and it’s working as expected. Now it’s running on non-ssl port (8080) I want to enable SSL configuration for the same. How do we enable SSL for Graphite? Can you please let me know… Thanks in advance !!
I am running to an error at this point that I cant seem to figure out root@localhost:/opt/graphite$ PYTHONPATH=/opt/graphite/webapp django-admin.py migrate --settings=graphite.settings --run-syncdb Traceback (most recent call last): File “/bin/django-admin.py”, line 5, in <module> management.execute_from_command_line() File “/usr/lib/python2.7/site-packages/django/core/management/init.py”, line 353, in execute_from_command_line utility.execute() File “/usr/lib/python2.7/site-packages/django/core/management/init.py”, line 302, in execute settings.INSTALLED_APPS File “/usr/lib/python2.7/site-packages/django/conf/init.py”, line 55, in getattr self._setup(name) File “/usr/lib/python2.7/site-packages/django/conf/init.py”, line 43, in _setup self._wrapped = Settings(settings_module) File “/usr/lib/python2.7/site-packages/django/conf/init.py”, line 99, in init mod = importlib.import_module(self.SETTINGS_MODULE) File “/usr/lib64/python2.7/importlib/init.py”, line 37, in import_module import(name) File “/opt/graphite/webapp/graphite/settings.py”, line 153, in <module> from graphite.local_settings import * # noqa File “/opt/graphite/webapp/graphite/local_settings.py”, line 14, in <module> SECRET_KEY = test NameError: name ‘test’ is not defined
Any idea what could causing this?
 This work is licensed under a Creative Commons Attribution-NonCommercial- ShareAlike 4.0 International License.
Become a contributor for community
Get paid to write technical tutorials and select a tech-focused charity to receive a matching donation.

DigitalOcean Documentation
Full documentation for every DigitalOcean product.

Resources for startups and AI-native businesses
The Wave has everything you need to know about building a business, from raising funding to marketing your product.
The developer cloud
Scale up as you grow — whether you're running one virtual machine or ten thousand.

Start building today
From GPU-powered inference and Kubernetes to managed databases and storage, get everything you need to build, scale, and deploy intelligent applications.
