")
Introduction
IP Geolocation, the process used to determine the physical location of an IP address, can be leveraged for a variety of purposes, such as content personalization and traffic analysis. Traffic analysis by geolocation can provide valuable insight into your user base as it allows you to easily see where they are coming from. This can help you make informed decisions about the ideal geographical location(s) of your application servers and who your current audience is.
In this tutorial, we will show you how to create a visual geo-mapping of the IP addresses of your application’s users, by using Elasticsearch, Logstash, and Kibana.
Here’s a short explanation of how it all works. Logstash uses a GeoIP database to convert IP addresses into a latitude and longitude coordinate pair, i.e. the approximate physical location of an IP address. The coordinate data is stored in Elasticsearch in geo_point fields, and also converted into a geohash string. Kibana can then read the Geohash strings and draw them as points on a map of the Earth. In Kibana 4, this is known as a Tile Map visualization.
Let’s take a look at the prerequisites now.
Prerequisites
To follow this tutorial, you must have a working ELK stack. Additionally, you must have logs that contain IP addresses that can be filtered into a field, like web server access logs. If you don’t already have these two things, you can follow the first two tutorials in this series. The first tutorial will set up an ELK stack, and the second one will show you how to gather and filter Nginx or Apache access logs:
- How To Install Elasticsearch, Logstash, and Kibana 4 on Ubuntu 14.04
- Adding Logstash Filters To Improve Centralized Logging
Add geo_point Mapping to Filebeat Index
Assuming you followed the prerequisite tutorials, you have already done this. However, we are including this step again in case you skipped it, because the TileMap visualization requires that your GeoIP coordinates are stored in Elasticsearch as a geo_point type.
On the server that Elasticsearch is installed on, download the Filebeat index template to your home directory:
- cd ~
- curl -O https://gist.githubusercontent.com/thisismitch/3429023e8438cc25b86c/raw/d8c479e2a1adcea8b1fe86570e42abab0f10f364/filebeat-index-template.json
Then load the template into Elasticsearch with this command:
- curl -XPUT 'http://localhost:9200/_template/filebeat' -d@filebeat-index-template.json
Configure Logstash to use GeoIP
To get Logstash to store GeoIP coordinates, you need to identify an application that generates logs that contain a public IP address that you can filter as a discrete field. A fairly ubiquitous application that generates logs with this information is a web server, such as Nginx or Apache. We will use Nginx access logs as the example. If you’re using different logs, make the necessary adjustments to the example.
In the Adding Filters to Logstash tutorial, the Nginx filter is stored in a file called 11-nginx-filter.conf. If your filter is located elsewhere, edit that file instead.
Let’s edit the Nginx filter now:
- sudo vi /etc/logstash/conf.d/11-nginx-filter.conf
Under the grok section, add the highlighted portion below:
filter {
  if [type] == "nginx-access" {
    grok {
      match => { "message" => "%{NGINXACCESS}" }
    }
    geoip {
      source => "clientip"
    }
  }
}
This configures the filter to convert an IP address stored in the clientip field (specified in source). We are specifying the source as clientip because that is the name of the field that the Nginx user IP address is being stored in. Be sure to change this value if you are storing the IP address information in a different field.
Save and exit.
To put the changes into effect, let’s restart Logstash:
- sudo service logstash restart
If everything was configured correctly, Logstash should now be storing the GeoIP coordinates with your Nginx access logs (or whichever application is generating the logs). Note that this change is not retroactive, so your previously gathered logs will not have GeoIP information added. Let’s verify that the GeoIP functionality is working properly in Kibana.
Connect to Kibana
The easiest way to verify if Logstash was configured correctly, with GeoIP enabled, is to open Kibana in a web browser. Do that now.
Find a log message that your application generated since you enabled the GeoIP module in Logstash. Following the Nginx example, we can search Kibana for type: "nginx-access" to narrow the log selection.
Then expand one of the messages to look at the table of fields. You should see some new geoip fields that contain information about how the IP address was mapped to a real geographical location. For example:
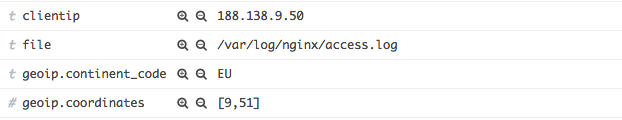
Note: If you don’t see any logs, generate some by accessing your application, and ensure that your time filter is set to a recent time.
Also note that Kibana may not be able to resolve a geolocation for every IP address. If you’re just testing with one address and it doesn’t seem to be working, try some others before troubleshooting.
If, after all that, you don’t see any GeoIP information (or if it’s incorrect), you probably did not configure Logstash properly.
If you see proper GeoIP information in this view, you are ready to create your map visualization.
Create Tile Map Visualization
Note: If you haven’t used Kibana visualizations yet, check out the Kibana Dashboards and Visualizations Tutorial.
To map out the IP addresses in Kibana, let’s create a Tile Map visualization.
Click Visualize in the main menu.
Under Create a new visualization, select Tile map.
Under Select a search source you may select either option. If you have a saved search that will find the log messages that you want to map, feel free to select that search. We will proceed as if you clicked From a new search.
When prompted to Select an index pattern choose filebeat-* from the dropdown. This will take you to a page with a blank map:
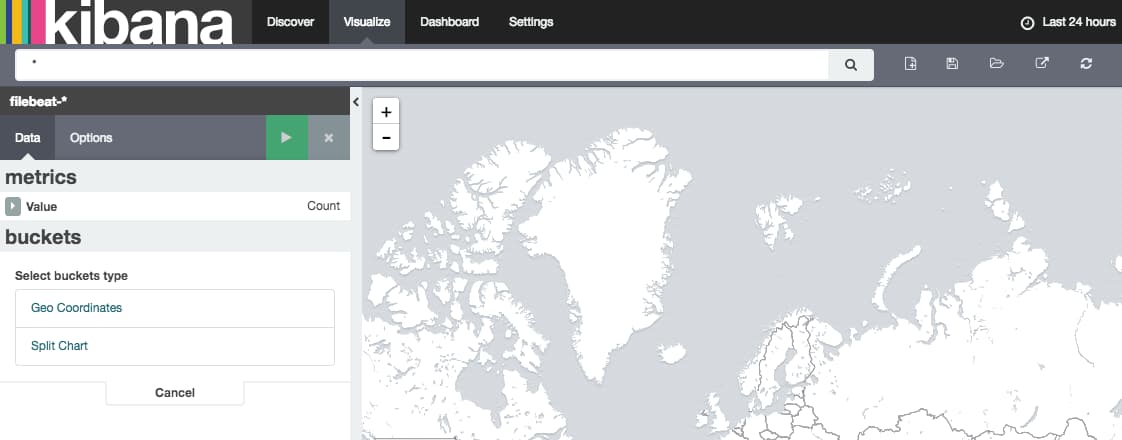
In the search bar, enter type: nginx-access or another search term that will match logs that contain geoip information. Make sure your time period (upper right corner of the page) is sufficient to match some log entries. If you see No results found instead of the map, you need to update your search terms or time.
Once you have some results, click Geo Coordinates underneath the buckets header in the left-hand column. The green “play” button will become active. Click it, and your geolocations will be plotted on the map:
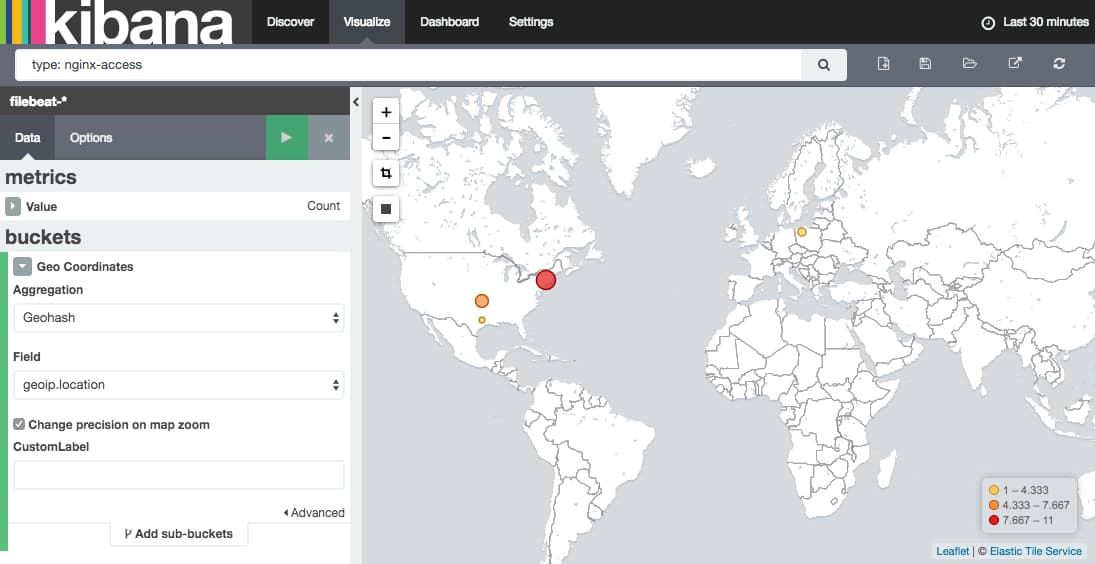
When you are satisfied with your visualization, be sure to save it using the Save Visualization button (floppy disk icon) next to the search bar.
Conclusion
Now that you have your GeoIP information mapped out in Kibana, you should be set. By itself, it should give you a rough idea of the geographical location of your users. It can be even more useful if you correlate it with your other logs by adding it to a dashboard.
Good luck!
Thanks for learning with the DigitalOcean Community. Check out our offerings for compute, storage, networking, and managed databases.
Tutorial Series: Centralized Logging with ELK Stack (Elasticsearch, Logstash, and Kibana) On Ubuntu 14.04
Centralized logging can be very useful when attempting to identify problems with your servers or applications, as it allows you to search through all of your logs in a single place. It is also useful because it allows you to identify issues that span multiple servers by correlating their logs during a specific time frame.
This series will teach you how to install Logstash and Kibana on Ubuntu, then how to add more filters to structure your log data. Then it will teach you how to use Kibana.
Tutorial Series: Centralized Logging with Logstash and Kibana On CentOS 7
Centralized logging can be very useful when attempting to identify problems with your servers or applications, as it allows you to search through all of your logs in a single place. It is also useful because it allows you to identify issues that span multiple servers by correlating their logs during a specific time frame. This series will teach you how to install Logstash and Kibana on Ubuntu, then how to add more filters to structure your log data. Then it will teach you how to use Kibana.
About the author
Software Engineer @ DigitalOcean. Former Señor Technical Writer (I no longer update articles or respond to comments). Expertise in areas including Ubuntu, PostgreSQL, MySQL, and more.
Still looking for an answer?
This textbox defaults to using Markdown to format your answer.
You can type !ref in this text area to quickly search our full set of tutorials, documentation & marketplace offerings and insert the link!
Thanks for your nice tutorial.
Please also provide Step-by-Step Setup of ELK for NetFlow traffic Analytics. (Kibana 4 Preferred) so that we can monitor traffic from different sources like Router, Firewall and server.
Thanks Ashik
This comment has been deleted
Hi,
Thanks for the nice tutorial.
Just to mention, you may need to change the mappings for geoip.location field and set it to ‘geo_point’ or else you won’t be able to get the Field ‘geiop.location’ displayed under Geo Co-ordinates > Field when you try to create a MAP.
I was using an index called ‘apache’ so initially the filed was set to double
$ curl http://localhost:9200/apache*/_mapping/apache-access/field/geoippretty
{
  "apache" : {
    "mappings" : {
      "apache-access" : {
        "geoip.location" : {
          "full_name" : "geoip.location",
          "mapping":{"location":{"type":"double"}}
        }
      }
    }
  }
}
I had to change it to ‘geo-point’ to get the filed on the map.
$curl http://localhost:9200/apache*/_mapping/apache-access/field/geoip.location?pretty
{
  "apache" : {
    "mappings" : {
      "apache-access" : {
        "geoip.location" : {
          "full_name" : "geoip.location",
          "mapping":{"location":{"type":"geo_point"}}
        }
      }
    }
  }
}
To change the mappings:
- copy the default lib/logstash/outputs/elasticsearch/elasticsearch-template.json to something like lib/logstash/outputs/elasticsearch/elasticsearch-apache-template.json
- Edit the elasticsearch-apache-template.json and give it a name “template” : “apache”,
- You will require to delete your existing index (THIS WILL LOOSE DATA). curl -XDELETE http://localhost:9200/apache*
- Edit your logstash.conf file to include the template in the output
output {
  elasticsearch {
     host => localhost
     cluster => es_24
     index   => "apache"
     template => "path_to_elasticsearch-apache-template.json"
     template_name => "apache"
  }
  stdout { codec => rubydebug }
}
- Restart ES and LS and it should work.
Hello, Mitchell Anicas I encountered a problem about grok pattern in my elk environment. Could you help me? Follows:
- My nginx log format:
log_format access '$remote_addr - $remote_user [$time_local] "$request"' '$status $body_bytes_sent $request_body "$http_referer"' '
"$http_user_agent"  $http_x_forwarded_for $host $request_time $upstream_response_time' " $upstream_cache_status";
- log contents :
124.134.229.30 - - [18/Aug/2015:03:30:01 +0800] "POST /?nav=24xsc&flaglot=hnquick5&tit=%E6%B2%B3%E5%86%855%E5%88%86%E5%BD%A9 HTTP/1.0"200 23 lotteryid=14&issue=20150818-043&flag=gettime "http://x8shi.com/?nav=24xsc&flaglot=hnquick5&tit=%E6%B2%B3%E5%86%855%E5%88%86%E5%BD%A9""Mozilla/5.0 (Windows NT 6.1; WOW64) AppleWebKit/537.36 (KHTML, like Gecko) Chrome/31.0.1650.63 Safari/537.36" 124.134.229.30 x8shi.com 0.140 0.027 -
now how to write a grok pattern ? I have tried many times,but all failed.
tags _grokparsefailure
Please help me ! Thank you very much !
Hi Manica, first of all thanks for your tutorials.
I’ve problems with mi geoip ip configuration, i’ve kibana 4.1.1 with logstash 1.5.3 and apache 2.4.
This is my personalized geoip file configuration on logstash, i called 12-geoip.conf :
filter { if [type] == “apache_access” { grok { match => { “message” => “%{COMMONAPACHELOG}” }
} geoip { source => “clientip” target => “geoip.location” database => “/etc/logstash/GeoLiteCity.dat” add_field => [ “[geoip.location][coordinates]”, “%{[geoip.location][longitude]}” ] add_field => [ “[geoip.location][coordinates]”, “%{[geoip.location][latitude]}” ] } mutate { convert => [ “[geoip.location][coordinates]”, “float”] } } }
Mi apache configuration on other file filter { if [type] == “apache” { grok { match => { “message” => “%{COMBINEDAPACHELOG}” } add_field => [ “received_from”, “%{host}” ] } } }
My problem is that Kibana don’t appears the “geoip” field, but clientip, hostname, etc… appears.
Part of my logstash-forwarder configuration
{
  "paths": [
    "/var/log/apache2/*error.log",
    "/var/log/apache2/*access-ssl.log"
   ],
  "fields": { "type": "apache" }
},
{
  "paths": [
    "/var/log/apache2/*access.log"
   ],
  "fields": { "type": "apache_access" }
 }
] }
And my logstash-forwarder registered events:
2015/09/04 09:07:57.807119 Registrar: processing 5 events 2015/09/04 09:08:45.244783 Registrar: processing 2 events 2015/09/04 09:08:50.238178 Registrar: processing 2 events 2015/09/04 09:09:02.744967 Registrar: processing 1 events
Thax so much Manica.
Hi Manica i have problems
i finally created my own “index pattern”, i have my template, and when logstash starting catch my template, i see that with the kopf plugin but my problem continues
My geoip and client mappings:
"geoip": {
  "dynamic": "true",
  "properties": {
    "location": {
      "doc_values": true,
      "type": "geo_point"
    },
    "longitude": {
      "doc_values": true,
      "type": "float"
    },
    "latitude": {
      "doc_values": true,
      "type": "float"
    },
    "ip": {
      "doc_values": true,
      "type": "ip"
    }
  }
},
for client ip:
"clientip": {
    "doc_values": true,
    "type": "ip"
  },
I regenerated thel index and appears the new fields:
this is my apache configuration for logstash
filter {
  if [type] == "apache_error" {
    grok {
      pattern => "%{COMBINEDAPACHELOG}"
      add_field => [ "received_from", "%{host}" ]
    }
  }
}
filter {
  if [type] == "apache_access" {
    grok {
      match => {"message" => "%{COMBINEDAPACHELOG}" }
    }
    geoip {
      source => "clientip"
      target => "geoip"
      database => "/etc/logstash/GeoLiteCity.dat"
      add_field => [ "[geoip][coordinates]", "%{[geoip][longitude]}" ]
      add_field => [ "[geoip][coordinates]", "%{[geoip][latitude]}" ]
    }
    mutate {
      convert => [ "[geoip][coordinates]", "float" ]
    }
  }
}
filter {
  if [type] == "apache_access_ssl" {
    grok {
      match => {"message" => "%{COMBINEDAPACHELOG}" }
    }
    geoip {
      source => "clientip"
      target => "geoip"
      database => "/etc/logstash/GeoLiteCity.dat"
      add_field => [ "[geoip][coordinates]", "%{[geoip][longitude]}" ]
      add_field => [ "[geoip][coordinates]", "%{[geoip][latitude]}" ]
    }
    mutate {
      convert => [ "[geoip][coordinates]", "float" ]
    }
  }
}
and the output for logstash
output {
  elasticsearch {
    host => "marioneto01"
    cluster => "oknels"
    protocol => "http"
    index => "okn-%{+YYYY.MM.dd}"
    template => "/opt/logstash/vendor/bundle/jruby/1.9/gems/logstash-output-elasticsearch-1.0.5-java/lib/logstash/outputs/elasticsearch/okn-template.json"
    template_name => "okn-*"
    manage_template => "true"
    #template_overwrite => "true"
  }
  stdout { codec => rubydebug }
}
ideas?? thanks
Hi, Mitchell Anicas
I want to Thank you from the bottom of my heart, for your wonderful tutorials on ELK stack. They are so great and step by step with you, I have completed the all three tutorials. The only thing left is to try the final one, which is about Map User Location. the problem I don’t have Apache or Nginx server hosting a real website where people are accessing it with their IP.
But again Thank you mate for your wonderful tutorials.
What a neat tutorial … hats off to author and team … keep up good work !! SF From SW England ! P.S. Is there any place i can see a example of application log which use log4j logs … btway that’s what i m going to do next …
Any pointers on how to do this for fluentd (using logstash format) instead of logstash?
Followed every part of the tutorial ,
Getting the Error ,
No Compatible Fields: The “[filebeat-]YYYY.MM.DD” index pattern does not contain any of the following field types: geo_point
have searched Google and unable to find the root cause of this error , can you help
 This work is licensed under a Creative Commons Attribution-NonCommercial- ShareAlike 4.0 International License.
Become a contributor for community
Get paid to write technical tutorials and select a tech-focused charity to receive a matching donation.

DigitalOcean Documentation
Full documentation for every DigitalOcean product.

Resources for startups and AI-native businesses
The Wave has everything you need to know about building a business, from raising funding to marketing your product.
The developer cloud
Scale up as you grow — whether you're running one virtual machine or ten thousand.

Start building today
From GPU-powered inference and Kubernetes to managed databases and storage, get everything you need to build, scale, and deploy intelligent applications.
