By vasanth prithvi and Rachel Lee

The author selected the COVID-19 Relief Fund to receive a donation as part of the Write for DOnations program.
Introduction
It is crucial for database administrators to avoid performance or memory issues. Tools such as Prometheus and Grafana can help you monitor your database cluster performance. Prometheus is an open-source monitoring and alerting platform that collects and stores metrics in time-series data. Grafana is an open-source web application for interactive visualization and analysis. It allows you to ingest data from a vast number of data sources, query this data, and display it on customizable charts for easy analysis. It is also possible to set alerts so you can quickly and easily be notified of unexpected behavior. Using them together allows you to collect, monitor, analyze, and visualize the data from your MongoDB instance.
In this tutorial, you will set up a MongoDB database and monitor it with Grafana using Prometheus as a data source. To accomplish this, you will configure the MongoDB exporter as a Prometheus target so that Prometheus can scrape your database metrics and make them available for Grafana.
Prerequisites
To follow this tutorial, you will need:
- One Ubuntu 20.04 server with a non-root user with
sudoprivileges and a firewall configured withufw, which you can do by following the Initial Server Setup Guide for Ubuntu 20.04. - MongoDB installed on the Ubuntu 20.04 server, which you can do by following the tutorial, How To Install MongoDB on Ubuntu 20.04.
- Grafana installed on the Ubuntu 20.04 server, which you can do by following Steps 1 through 4 of the tutorial, How To Install and Secure Grafana on Ubuntu 20.04.
To install Grafana, you will need the following:
- A fully registered domain name. This tutorial uses
your_domainthroughout. You can purchase a domain name on Namecheap, get one for free on Freenom, or use the domain registrar of your choice. - The following DNS records set up for your server. You can follow the How To Add Domains article for details on how to add them if you are using DigitalOcean.
- An A record with
your_domainpointing to your server’s public IP address. - An A record with
www.your_domainpointing to your server’s public IP address.
- An A record with
- Nginx set up by following the How To Install Nginx on Ubuntu 20.04 tutorial, including a server block for your domain.
- An Nginx server block with Let’s Encrypt configured, which you can set up by following How To Secure Nginx with Let’s Encrypt on Ubuntu 20.04.
Step 1 — Installing and Configuring Prometheus
Prometheus is an open-source systems monitoring and alerts toolkit that collects and stores metrics as time-series data. That is, the metrics information is stored with the timestamp at which it was recorded. In this step, you will install Prometheus and configure it to run as a service.
Installing Prometheus
First, you will need to install Prometheus. Begin by logging into your server and updating the package lists as follows:
- sudo apt update
Next, you’ll create the configuration and data directories for Prometheus. To create a configuration directory called prometheus, run the following command:
- sudo mkdir -p /etc/prometheus
Next, create the data directories:
- sudo mkdir -p /var/lib/prometheus
After creating the directories, you’ll download the compressed installation file. Prometheus installation files come in precompiled binaries in compressed files. To download Prometheus, visit the download page.
To download version 2.31.0, run the following command, replacing the version number as needed:
- wget https://github.com/prometheus/prometheus/releases/download/v2.31.0/prometheus-2.31.0.linux-amd64.tar.gz
Once downloaded, extract the tarball file:
- tar -xvf prometheus-2.31.0.linux-amd64.tar.gz
After extracting the file, navigate to the Prometheus folder:
- cd prometheus-2.31.0.linux-amd64
Then, move the prometheus and promtool binary files to the /usr/local/bin/ directory:
- sudo mv prometheus promtool /usr/local/bin/
Next, you’ll move all the files related to Prometheus to one location: /etc/prometheus/. To move the console files in the consoles directory and the library files in the console_libraries directory, run the following command:
- sudo mv consoles/ console_libraries/ /etc/prometheus/
The console and console library files are used to launch the Prometheus GUI. These files will be kept with the configuration files so that they can be used while starting the service.
Finally, move the prometheus.yml template configuration file to the /etc/prometheus/ directory:
- sudo mv prometheus.yml /etc/prometheus/prometheus.yml
prometheus.yml is the template configuration file where you will configure the port for Prometheus and which files to use while starting the service.
To check the version of Prometheus installed, run the command:
- prometheus --version
You’ll receive output similar to this:
Outputprometheus, version 2.31.0 (branch: HEAD, revision: b41e0750abf5cc18d8233161560731de05199330)
  build user:       root@0aa1b7fc430d
  build date:       20220714-15:13:18
  go version:       go1.18.4
  platform:         linux/amd64
In this section, you installed Prometheus and verified its version. Next, you’ll start it as a service.
Running Prometheus as a Service
Now that you have installed Prometheus, you’ll configure it to run as a service.
Before creating the system file to accomplish this, you’ll need to create a Prometheus group and user. You’ll need a dedicated user with owner access to the necessary directories. To create a prometheus group, run the following command:
- sudo groupadd --system prometheus
Next, create a prometheus user and assign it to the prometheus group you just created:
- sudo useradd -s /sbin/nologin --system -g prometheus prometheus
Change the directory ownership and permissions as follows so that the dedicated user has the correct permissions:
- sudo chown -R prometheus:prometheus /etc/prometheus/ /var/lib/prometheus/
- sudo chmod -R 775 /etc/prometheus/ /var/lib/prometheus/
Next, you’ll create the service file to run Prometheus as a service. Using nano or your favorite text editor, create a systemd service file called prometheus.service:
- sudo nano /etc/systemd/system/prometheus.service
Add the following lines of code:
[Unit]
Description=Prometheus
Wants=network-online.target
After=network-online.target

[Service]
User=prometheus
Group=prometheus
Restart=always
Type=simple
ExecStart=/usr/local/bin/prometheus \
    --config.file=/etc/prometheus/prometheus.yml \
    --storage.tsdb.path=/var/lib/prometheus/ \
    --web.console.templates=/etc/prometheus/consoles \
    --web.console.libraries=/etc/prometheus/console_libraries \
    --web.listen-address=0.0.0.0:9090

[Install]
WantedBy=multi-user.target
With this code, you configure Prometheus to use the files listed in the ExecStart block to run the service. The service file tells systemd to run Prometheus as the prometheus user with the configuration file /etc/prometheus/prometheus.yml and to store its data in the /var/lib/prometheus directory. You also configure Prometheus to run on port 9090. (The details of systemd service files are beyond the scope of this tutorial, but you can learn more at Understanding Systemd Units and Unit Files.)
Save and close your file. If using nano, press CTRL+X and then Y.
Now, start the Prometheus service:
- sudo systemctl start prometheus
Enable the Prometheus service to run at startup:
- sudo systemctl enable prometheus
You can check the service status using following command:
- sudo systemctl status prometheus
The output will confirm that the service is active (running):
● prometheus.service - Prometheus
     Loaded: loaded (/etc/systemd/system/prometheus.service; enabled; vendor preset: enabled)
     Active: active (running) since Fri 2022-08-05 18:06:05 UTC; 13s ago
   Main PID: 7177 (prometheus)
      Tasks: 6 (limit: 527)
     Memory: 21.0M
     CGroup: /system.slice/prometheus.service
             └─7177 /usr/local/bin/prometheus --config.file=/etc/prometheus/prometheus.yml --storage.tsdb.path=/var/lib/prometheus/ --web.console.template>
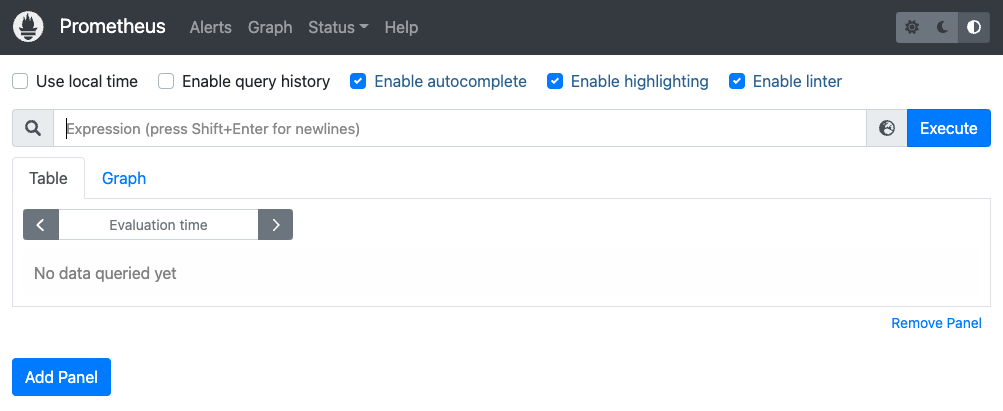
To access Prometheus, launch your browser and visit your server’s IP address followed by port 9090: http://your_server_ip:9090.
Note: To access the Prometheus web console, you may need to allow port 9090 on your server. To check your current UFW ruleset, run the following command:
- sudo ufw status
If port 9090 is not already allowed, you can add it using the following command:
- sudo ufw allow 9090
You can now access the Prometheus web console:
In this step, you installed Prometheus and configured it to run as a service. Next, you’ll bind your MongoDB database to Prometheus using the MongoDB exporter.
Step 2 — Configuring the MongoDB Exporter
Prometheus works by scraping targets to collect metrics. In this step, you will install the MongoDB exporter and configure it as a Prometheus target so that Prometheus can collect the data from your MongoDB instance.
Installing the MongoDB Exporter
In this section, you will install the MongoDB exporter. First, create a directory for the exporter and navigate to it:
- mkdir mongodb-exporter
- cd mongodb-exporter
The MongoDB exporter can be downloaded from Github. The exporter comes as a binary file in an archive, but you will configure it as a service. Download the binary file with the following command:
- wget https://github.com/percona/mongodb_exporter/releases/download/v0.7.1/mongodb_exporter-0.7.1.linux-amd64.tar.gz
Next, extract the downloaded archive into your current folder:
- tar xvzf mongodb_exporter-0.7.1.linux-amd64.tar.gz
Finally, move the mongodb_exporter binary to usr/local/bin/:
- sudo mv mongodb_exporter /usr/local/bin/
In this section, you installed the MongoDB exporter. Next, you will enable MongoDB authentication and create a user for monitoring.
Enabling MongoDB Authentication
In this section, you will set up MongoDB authentication for the MongoDB exporter and create a user to monitor the cluster’s metrics.
Begin by connecting to your MongoDB instance with mongo:
- mongo
You will create an administrator account for your exporter with the cluster monitor role. Switch to the admin database:
- use admin
After switching to the admin database, create a user with the clusterMonitor role:
- db.createUser({user: "test",pwd: "testing",roles: [{ role: "clusterMonitor", db: "admin" },{ role: "read", db: "local" }]})
You’ll receive the following output:
Successfully added user: {
        "user" : "test",
        "roles" : [
                {
                        "role" : "clusterMonitor",
                        "db" : "admin"
                },
                {
                        "role" : "read",
                        "db" : "local"
                }
        ]
}
After creating the user, exit the MongoDB shell:
- exit
Next, set your MongoDB URI environment variable with the appropriate authentication credentials:
export MONGODB_URI=mongodb://test:testing@localhost:27017
You set the MONGODB_URI to specify the mongodb instance that uses the authentication credentials you set earlier (the test user and testing password). 27017 is the default port for a mongodb instance. When you set the environment variable, it takes precedence over the profile stored in the configuration file.
To check that the MongoDO URI environment variable was set correctly, run the following command:
- env | grep mongodb
You’ll receive the following output:
MONGODB_URI=mongodb://mongodb_exporter:password@localhost:27017
In this section, you created a MongoDB user with the clusterMonitor role, which helps to monitor the cluster metrics. Next, you’ll configure the MongoDB exporter to run as a service.
Creating a Service for the MongoDB exporter
In this section, you will create a system file for the MongoDB exporter and run it as a service.
Navigate to /lib/systemd/system and create a new service file for the exporter using nano or your favorite text editor:
- cd /lib/systemd/system/
- sudo nano mongodb_exporter.service
Paste the following configuration into your service file:
[Unit]
Description=MongoDB Exporter
User=prometheus

[Service]
Type=simple
Restart=always
ExecStart=/usr/local/bin/mongodb_exporter

[Install]
WantedBy=multi-user.target
This service file tells systemd to run MongoDB exporter as a service under the prometheus user. ExecStart will run the mongodb_exporter binary from usr/local/bin/. For more about systemd service files, check out Understanding Systemd Units and Unit Files.
Save and close your file.
Next, restart your system daemon to reload the unit files:
- sudo systemctl daemon-reload
Now, start your service:
- sudo systemctl start mongodb_exporter.service
To check the status of the MongoDB exporter service, run the following command:
- sudo systemctl status mongodb_exporter.service
The output will confirm that the service is active (running):
● mongodb_exporter.service - MongoDB Exporter
     Loaded: loaded (/lib/systemd/system/mongodb_exporter.service; disabled; vendor preset: enabled)
     Active: active (running) since Fri 2022-08-05 18:18:38 UTC; 1 weeks 3 days ago
   Main PID: 7352 (mongodb_exporte)
      Tasks: 5 (limit: 527)
     Memory: 14.2M
     CGroup: /system.slice/mongodb_exporter.service
             └─7352 /usr/local/bin/mongodb_exporter
To ensure that everything is working as expected, navigate to the project root and run a curl command on port 9216, which is where the exporter runs:
- cd ~
- sudo curl http://localhost:9216/metrics
The output will be long, and will contain lines similar to this:
Output# HELP go_gc_duration_seconds A summary of the GC invocation durations.
# TYPE go_gc_duration_seconds summary
go_gc_duration_seconds{quantile="0"} 0
go_gc_duration_seconds{quantile="0.25"} 0
go_gc_duration_seconds{quantile="0.5"} 0
go_gc_duration_seconds{quantile="0.75"} 0
go_gc_duration_seconds{quantile="1"} 0
go_gc_duration_seconds_sum 0
go_gc_duration_seconds_count 0
# HELP go_goroutines Number of goroutines that currently exist.
# TYPE go_goroutines gauge
go_goroutines 11
# HELP go_memstats_alloc_bytes Number of bytes allocated and still in use.
# TYPE go_memstats_alloc_bytes gauge
go_memstats_alloc_bytes 1.253696e+06
# HELP go_memstats_alloc_bytes_total Total number of bytes allocated, even if freed.
# TYPE go_memstats_alloc_bytes_total counter
go_memstats_alloc_bytes_total 1.253696e+06
# HELP go_memstats_buck_hash_sys_bytes Number of bytes used by the profiling bucket hash table.
# TYPE go_memstats_buck_hash_sys_bytes gauge
go_memstats_buck_hash_sys_bytes 3054
# HELP go_memstats_frees_total Total number of frees.
# TYPE go_memstats_frees_total counter
go_memstats_frees_total 2866
# HELP go_memstats_gc_sys_byte
.
.
.
# HELP mongodb_asserts_total The asserts document reports the number of asserts on the database. While assert errors are typically uncommon, if there are non-zero values for the asserts, you should check the log file for the mongod process for more information. In many cases these errors are trivial, but are worth investigating.
# TYPE mongodb_asserts_total counter
mongodb_asserts_total{type="msg"} 0
mongodb_asserts_total{type="regular"} 0
mongodb_asserts_total{type="rollovers"} 0
mongodb_asserts_total{type="user"} 19
mongodb_asserts_total{type="warning"} 0
# HELP mongodb_connections The connections sub document data regarding the current status of incoming connections and availability of the database server. Use these values to assess the current load and capacity requirements of the server
# TYPE mongodb_connections gauge
mongodb_connections{state="available"} 51198
mongodb_connections{state="current"} 2
# HELP mongodb_connections_metrics_created_total totalCreated provides a count of all incoming connections created to the server. This number includes connections that have since closed
# TYPE mongodb_connections_metrics_created_total counter
mongodb_connections_metrics_created_total 6
# HELP mongodb_exporter_build_info A metric with a constant '1' value labeled by version, revision, branch, and goversion from which mongodb_exporter was built.
# TYPE mongodb_exporter_build_info gauge
mongodb_exporter_build_info{branch="v0.7.1",goversion="go1.11.10",revision="3002738d50f689c8204f70f6cceb8150b98fa869",version="0.7.1"} 1
# HELP mongodb_exporter_last_scrape_duration_seconds Duration of the last scrape of metrics from MongoDB.
# TYPE mongodb_exporter_last_scrape_duration_seconds gauge
mongodb_exporter_last_scrape_duration_seconds 0.003641888
# HELP mongodb_exporter_last_scrape_error Whether the last scrape of metrics from MongoDB resulted in an error (1 for error, 0 for success).
# TYPE mongodb_exporter_last_scrape_error gauge
mongodb_exporter_last_scrape_error 0
.
.
.
...
The output confirms that the MongoDB exporter is collecting metrics, such as the mongodb version, metrics-document, and the connections details.
In this section, you set up the MongoDB exporter as a service and collected metrics from MongoDB. Next, you will configure the exporter as a target for Prometheus.
Configuring the MongoDB Exporter as a Prometheus Target
In this section, you will configure the MongoDB exporter as a Prometheus target. Navigate to the directory holding your Prometheus configuration file:
- cd /etc/prometheus/
Using nano or your favorite text editor, open the file for editing:
- sudo nano prometheus.yml
Add the MongoDB exporter as a target by copying the highlighted lines into your file:
# A scrape configuration containing exactly one endpoint to scrape:
# Here it's Prometheus itself.
scrape_configs:
  # The job name is added as a label `job=<job_name>` to any timeseries scraped from this config.
  - job_name: "prometheus"
    static_configs:
            - targets: ["localhost:9090", "localhost:9216"]
9216 is the default port for the MongoDB exporter.
Save and close your file.
After adding the target, restart Prometheus:
- sudo systemctl restart prometheus
Navigate to http://localhost:9090/targets to verify that Prometheus is scraping your newly added exporter.
Note: If you are using a remote server, you can view the targets by navigating to http://your_server_ip:9090/targets. You could also use port-forwarding to view the targets locally. To do this, open a new terminal on your local computer and enter the following command:
- ssh -L 9090:localhost:9090 your_non_root_user@your_server_ip
Upon connecting to the server, navigate to http://localhost:9090/targets on your local machine’s web browser.
You will access a list of Prometheus targets:
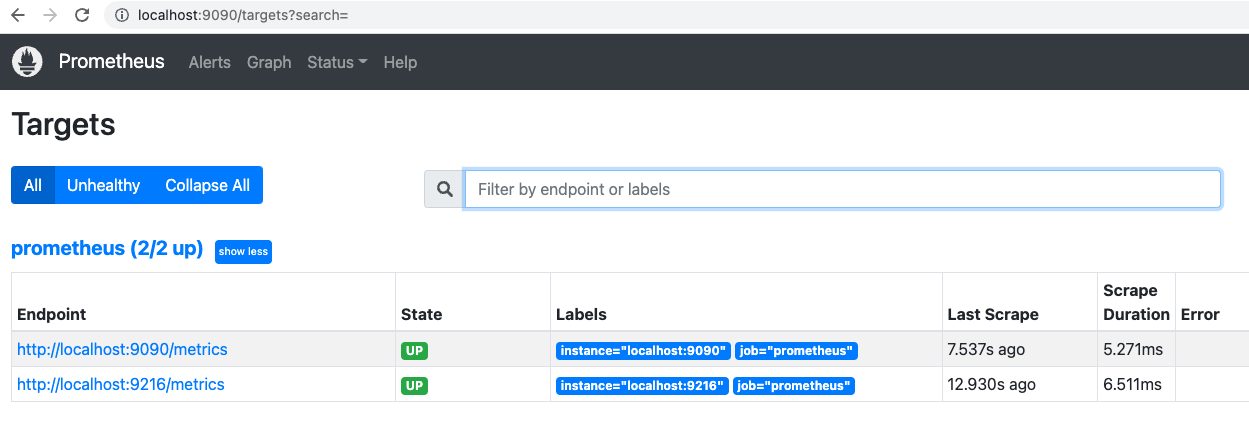
The 9090 endpoint is Prometheus scraping itself. The 9216 endpoint is the MongoDB exporter, which confirms your configuration is working as expected.
In this step, you installed the MongoDB exporter and configured it as a Prometheus target to collect metrics. Next, you will create a MongoDB dashboard in the Grafana web console to view and analyze these metrics.
Step 3 — Building a MongoDB Dashboard in Grafana
In this step, you will build a dashboard to visualize your MongoDB data in Grafana. To accomplish this, you will add Prometheus as a data source in Grafana and import a MongoDB dashboard from Percona. Percona provides multiple dashboards for MongoDB, which you can find in the Percona product documents. For this tutorial, you will import the MongoDB Overview dashboard into your Grafana instance. To begin, you’ll set Prometheus as a Grafana data source.
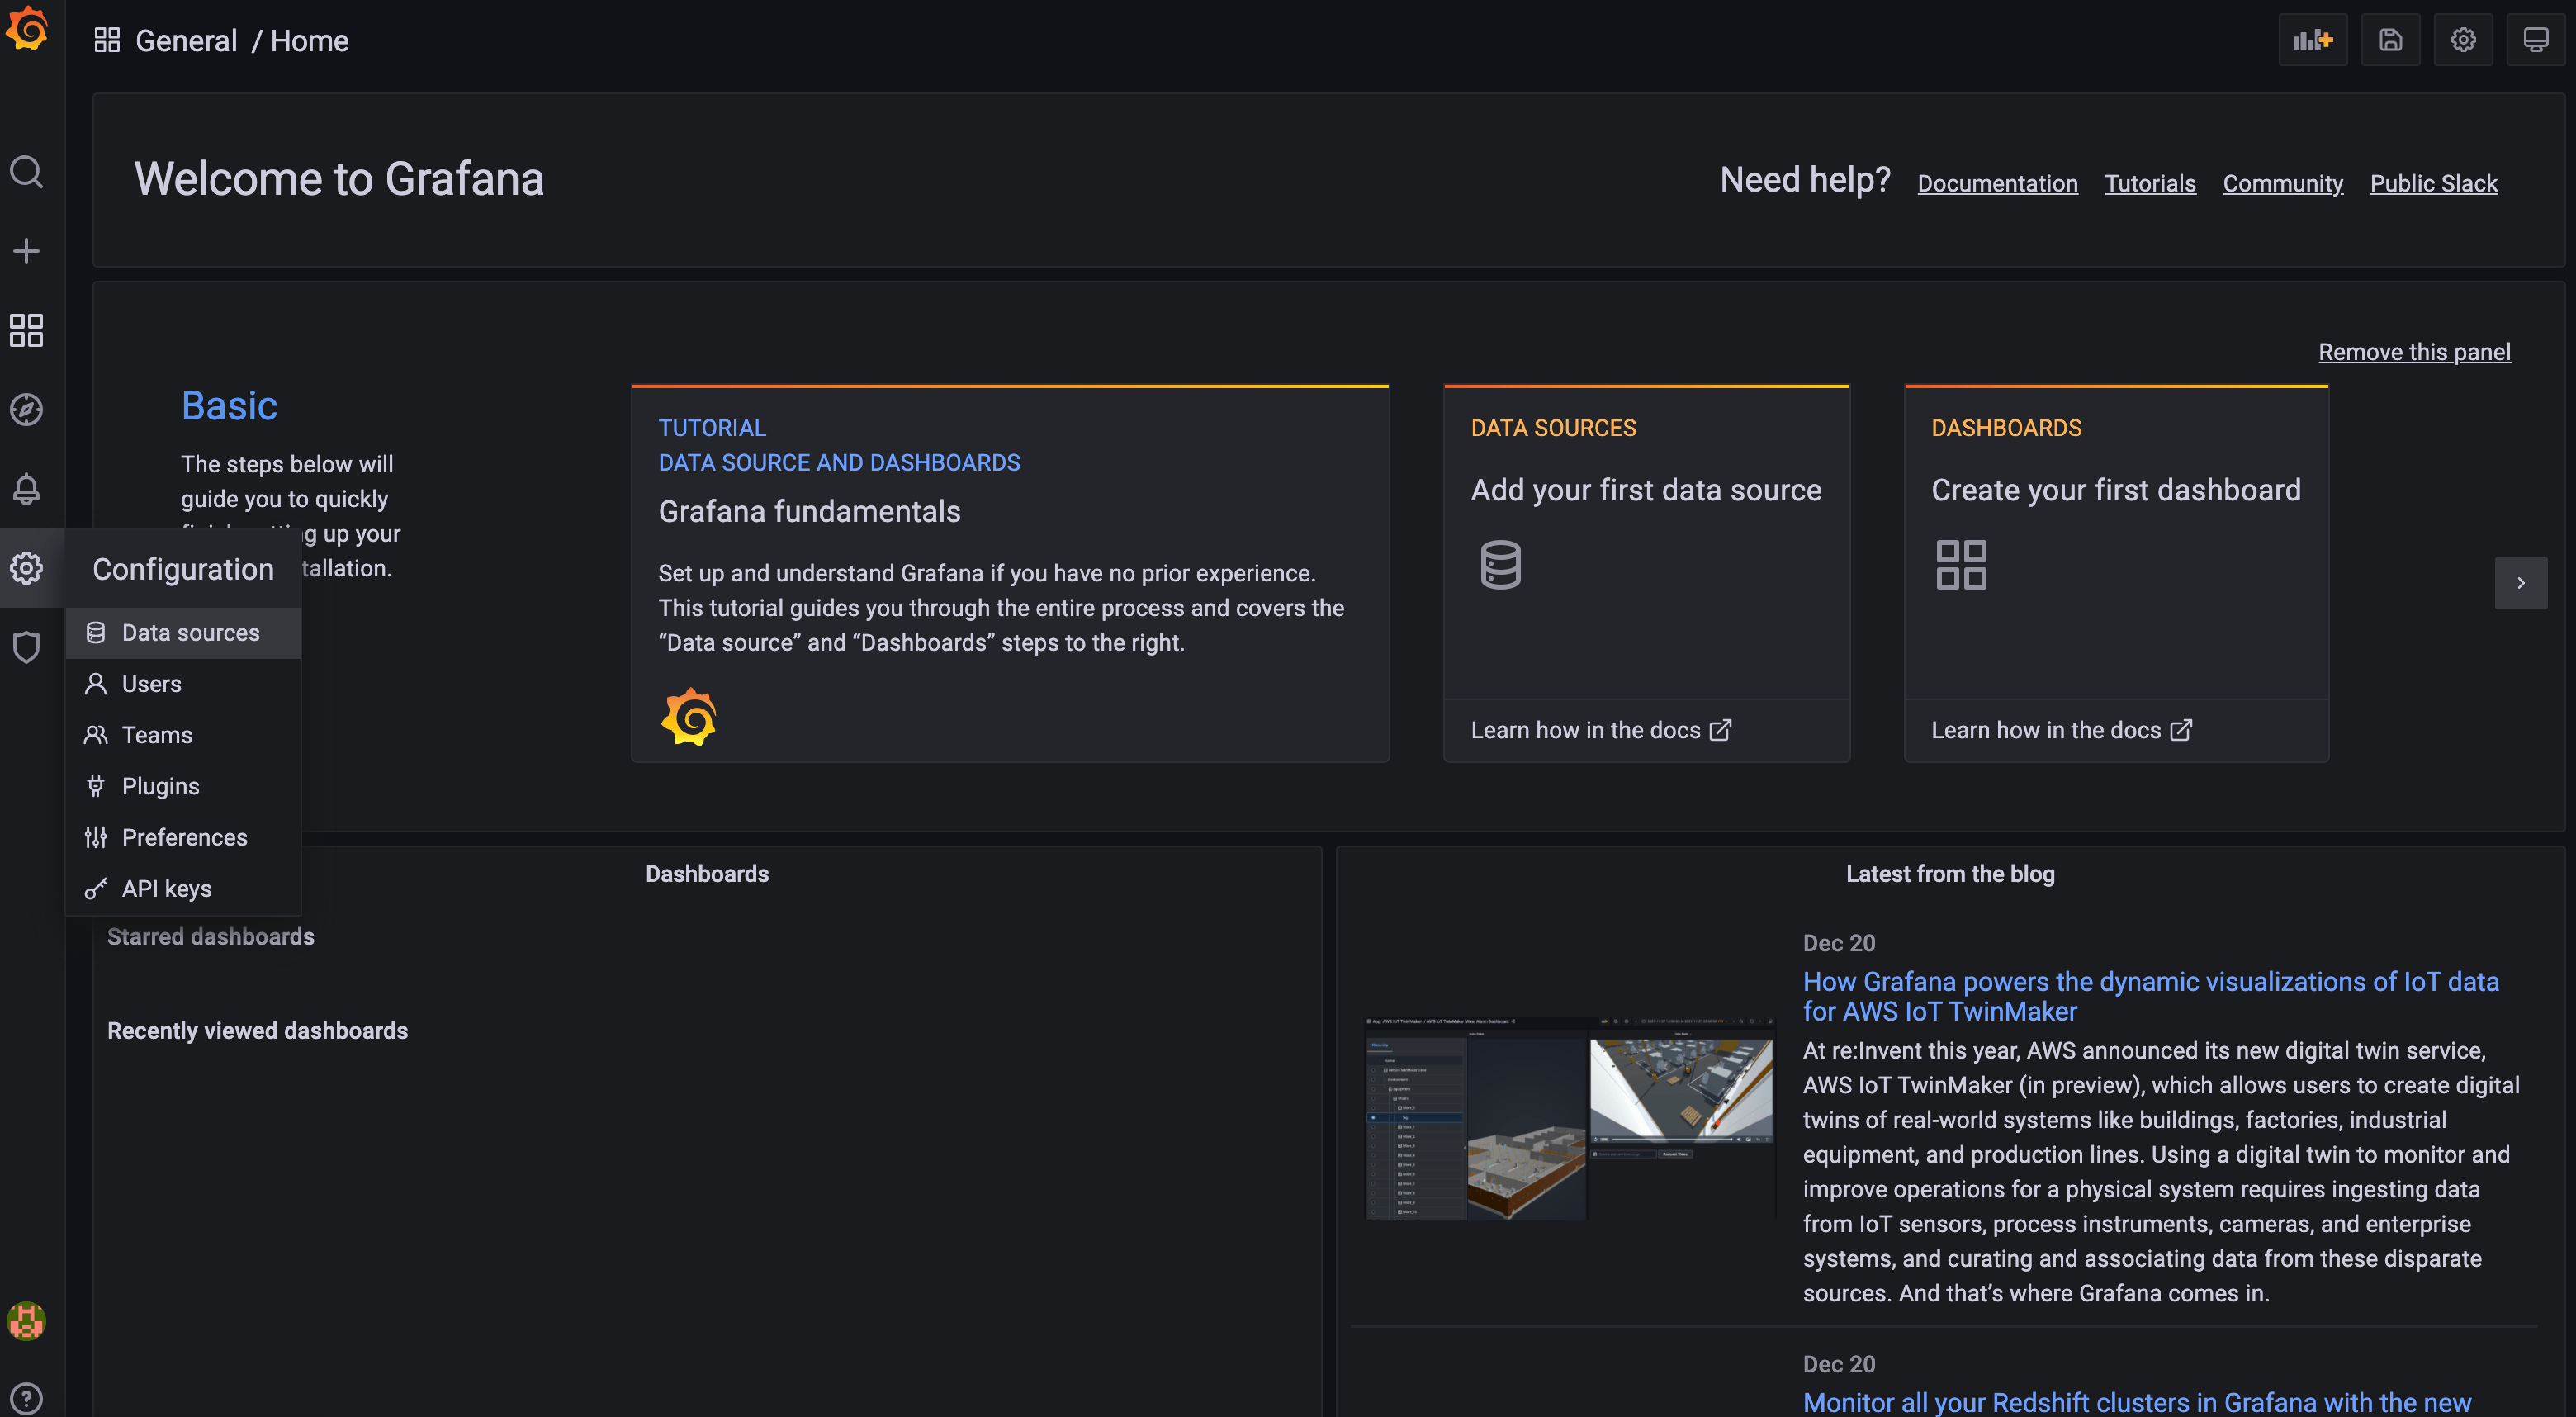
As part of the prerequisites, you installed and secured Grafana. Navigate to your Grafana instance at your_domain:3000 and log in using the credentials you created during the prerequisites.
In the left panel, click the gear icon for Configuration, then select Data Sources:
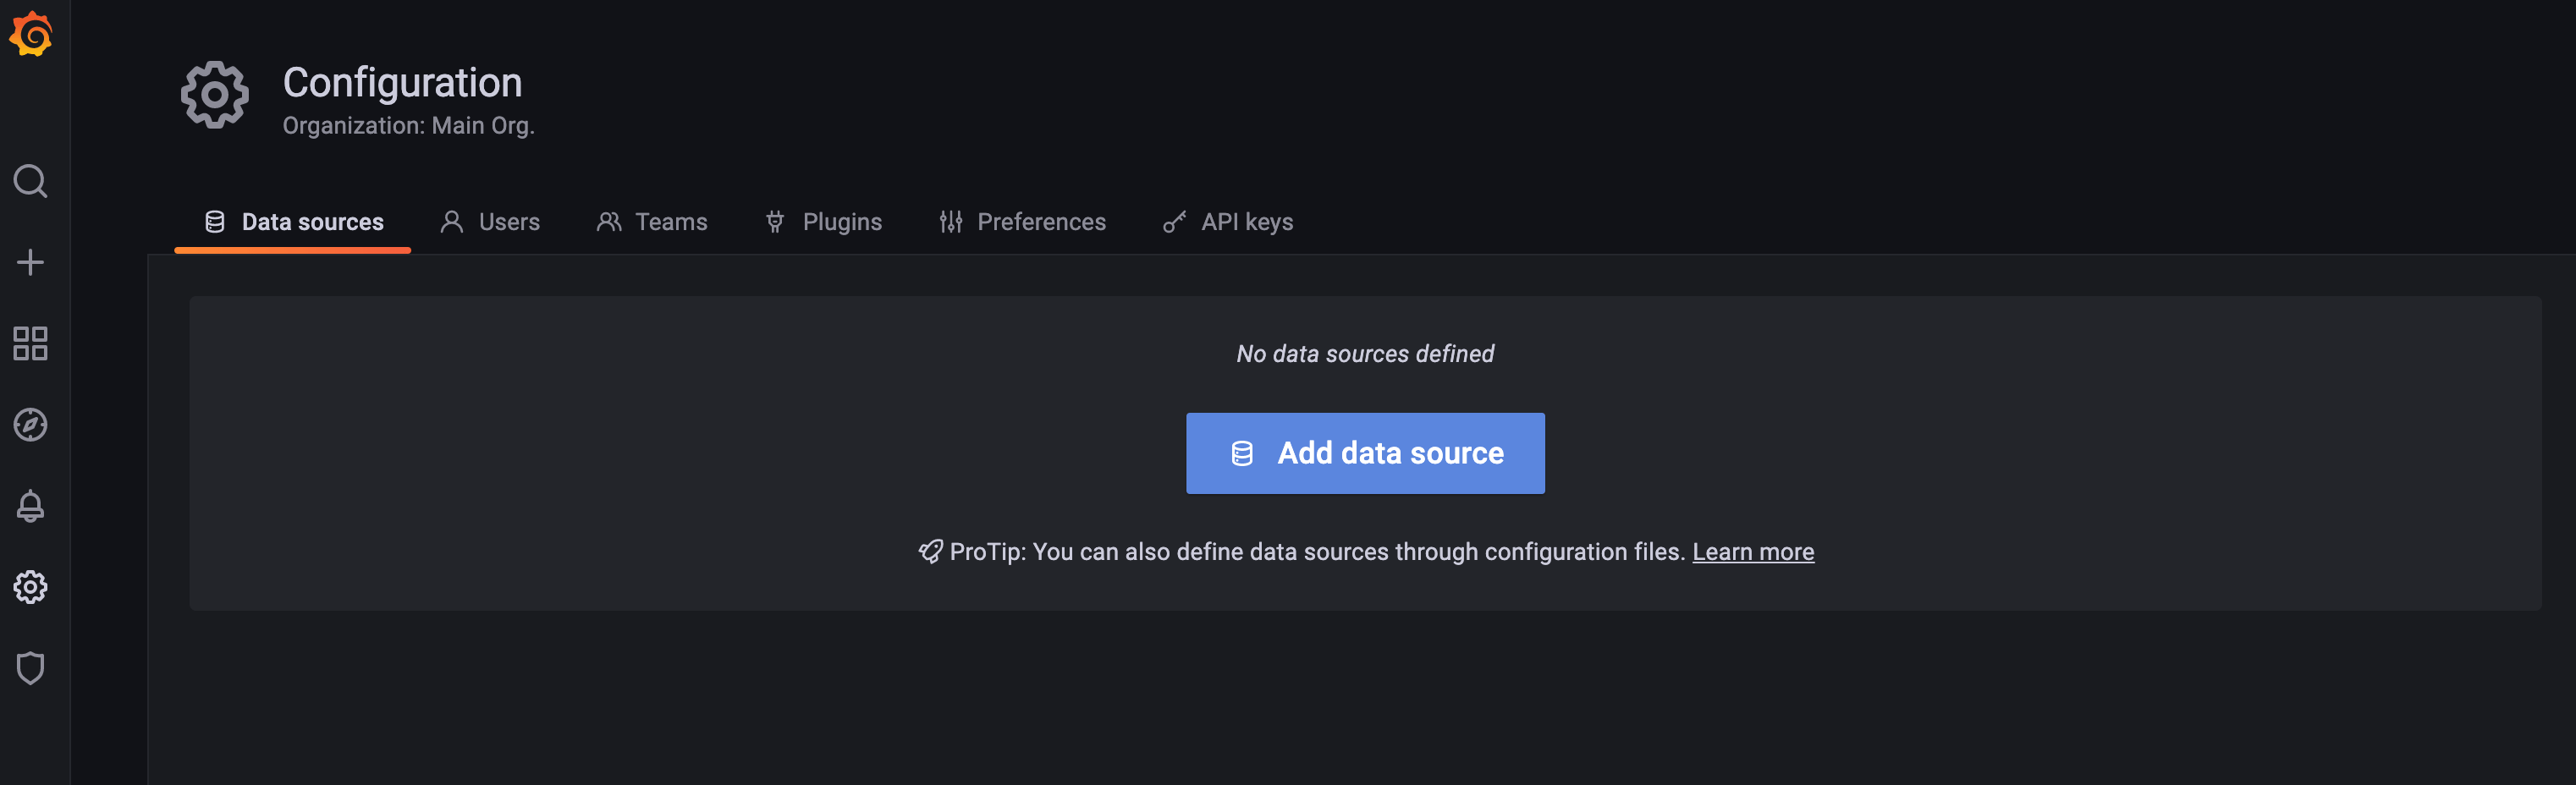
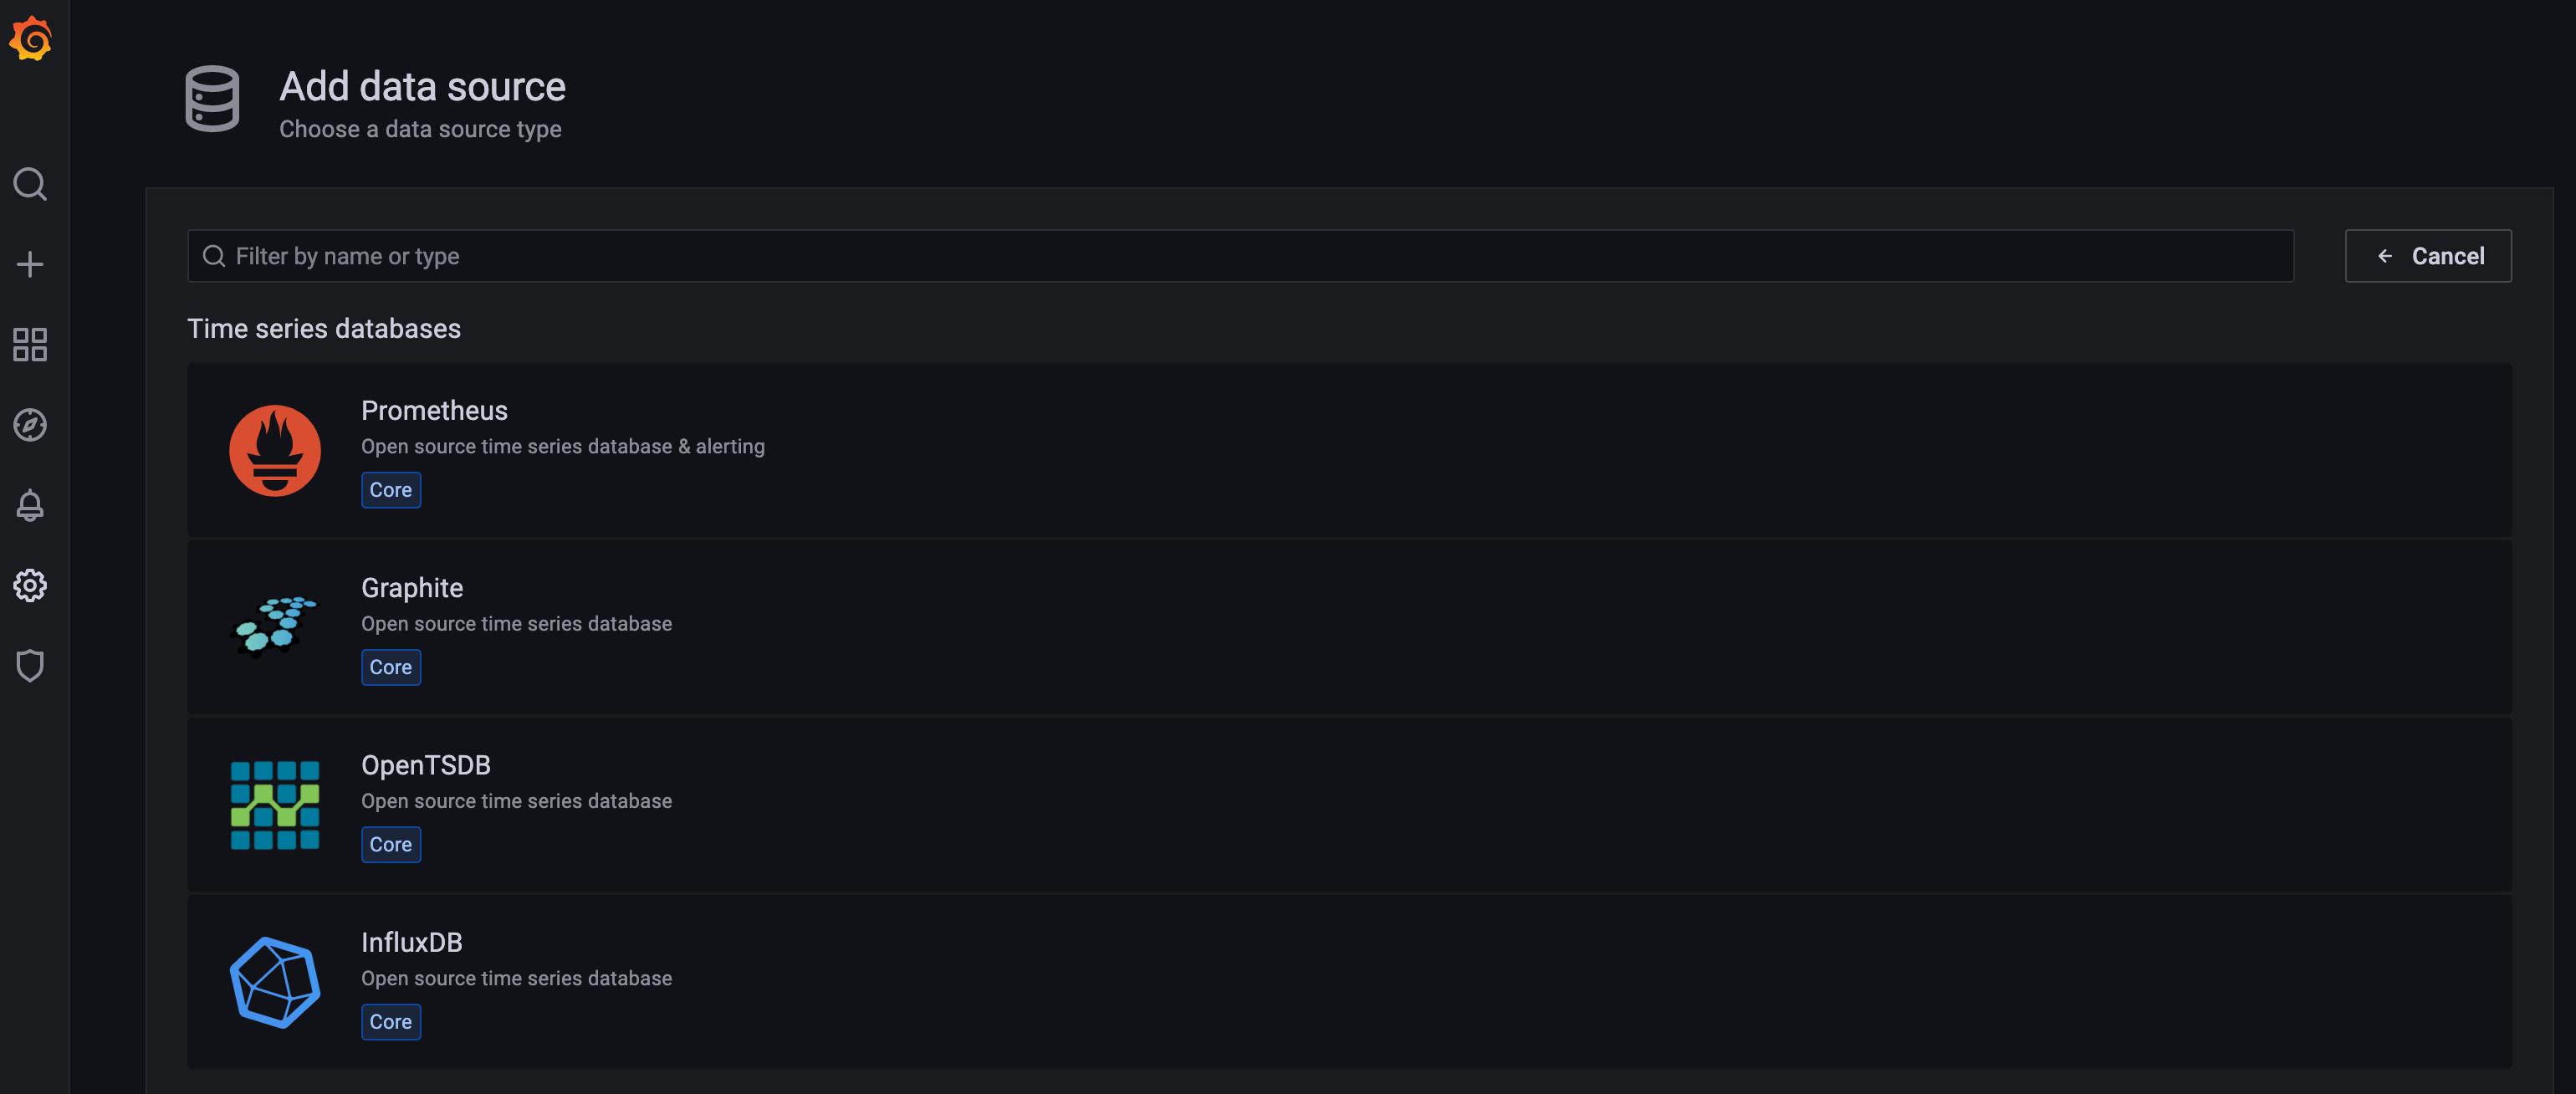
Click on Add data source:
Then select Prometheus:
On the next screen, you’ll configure the Settings for your Prometheus data source:
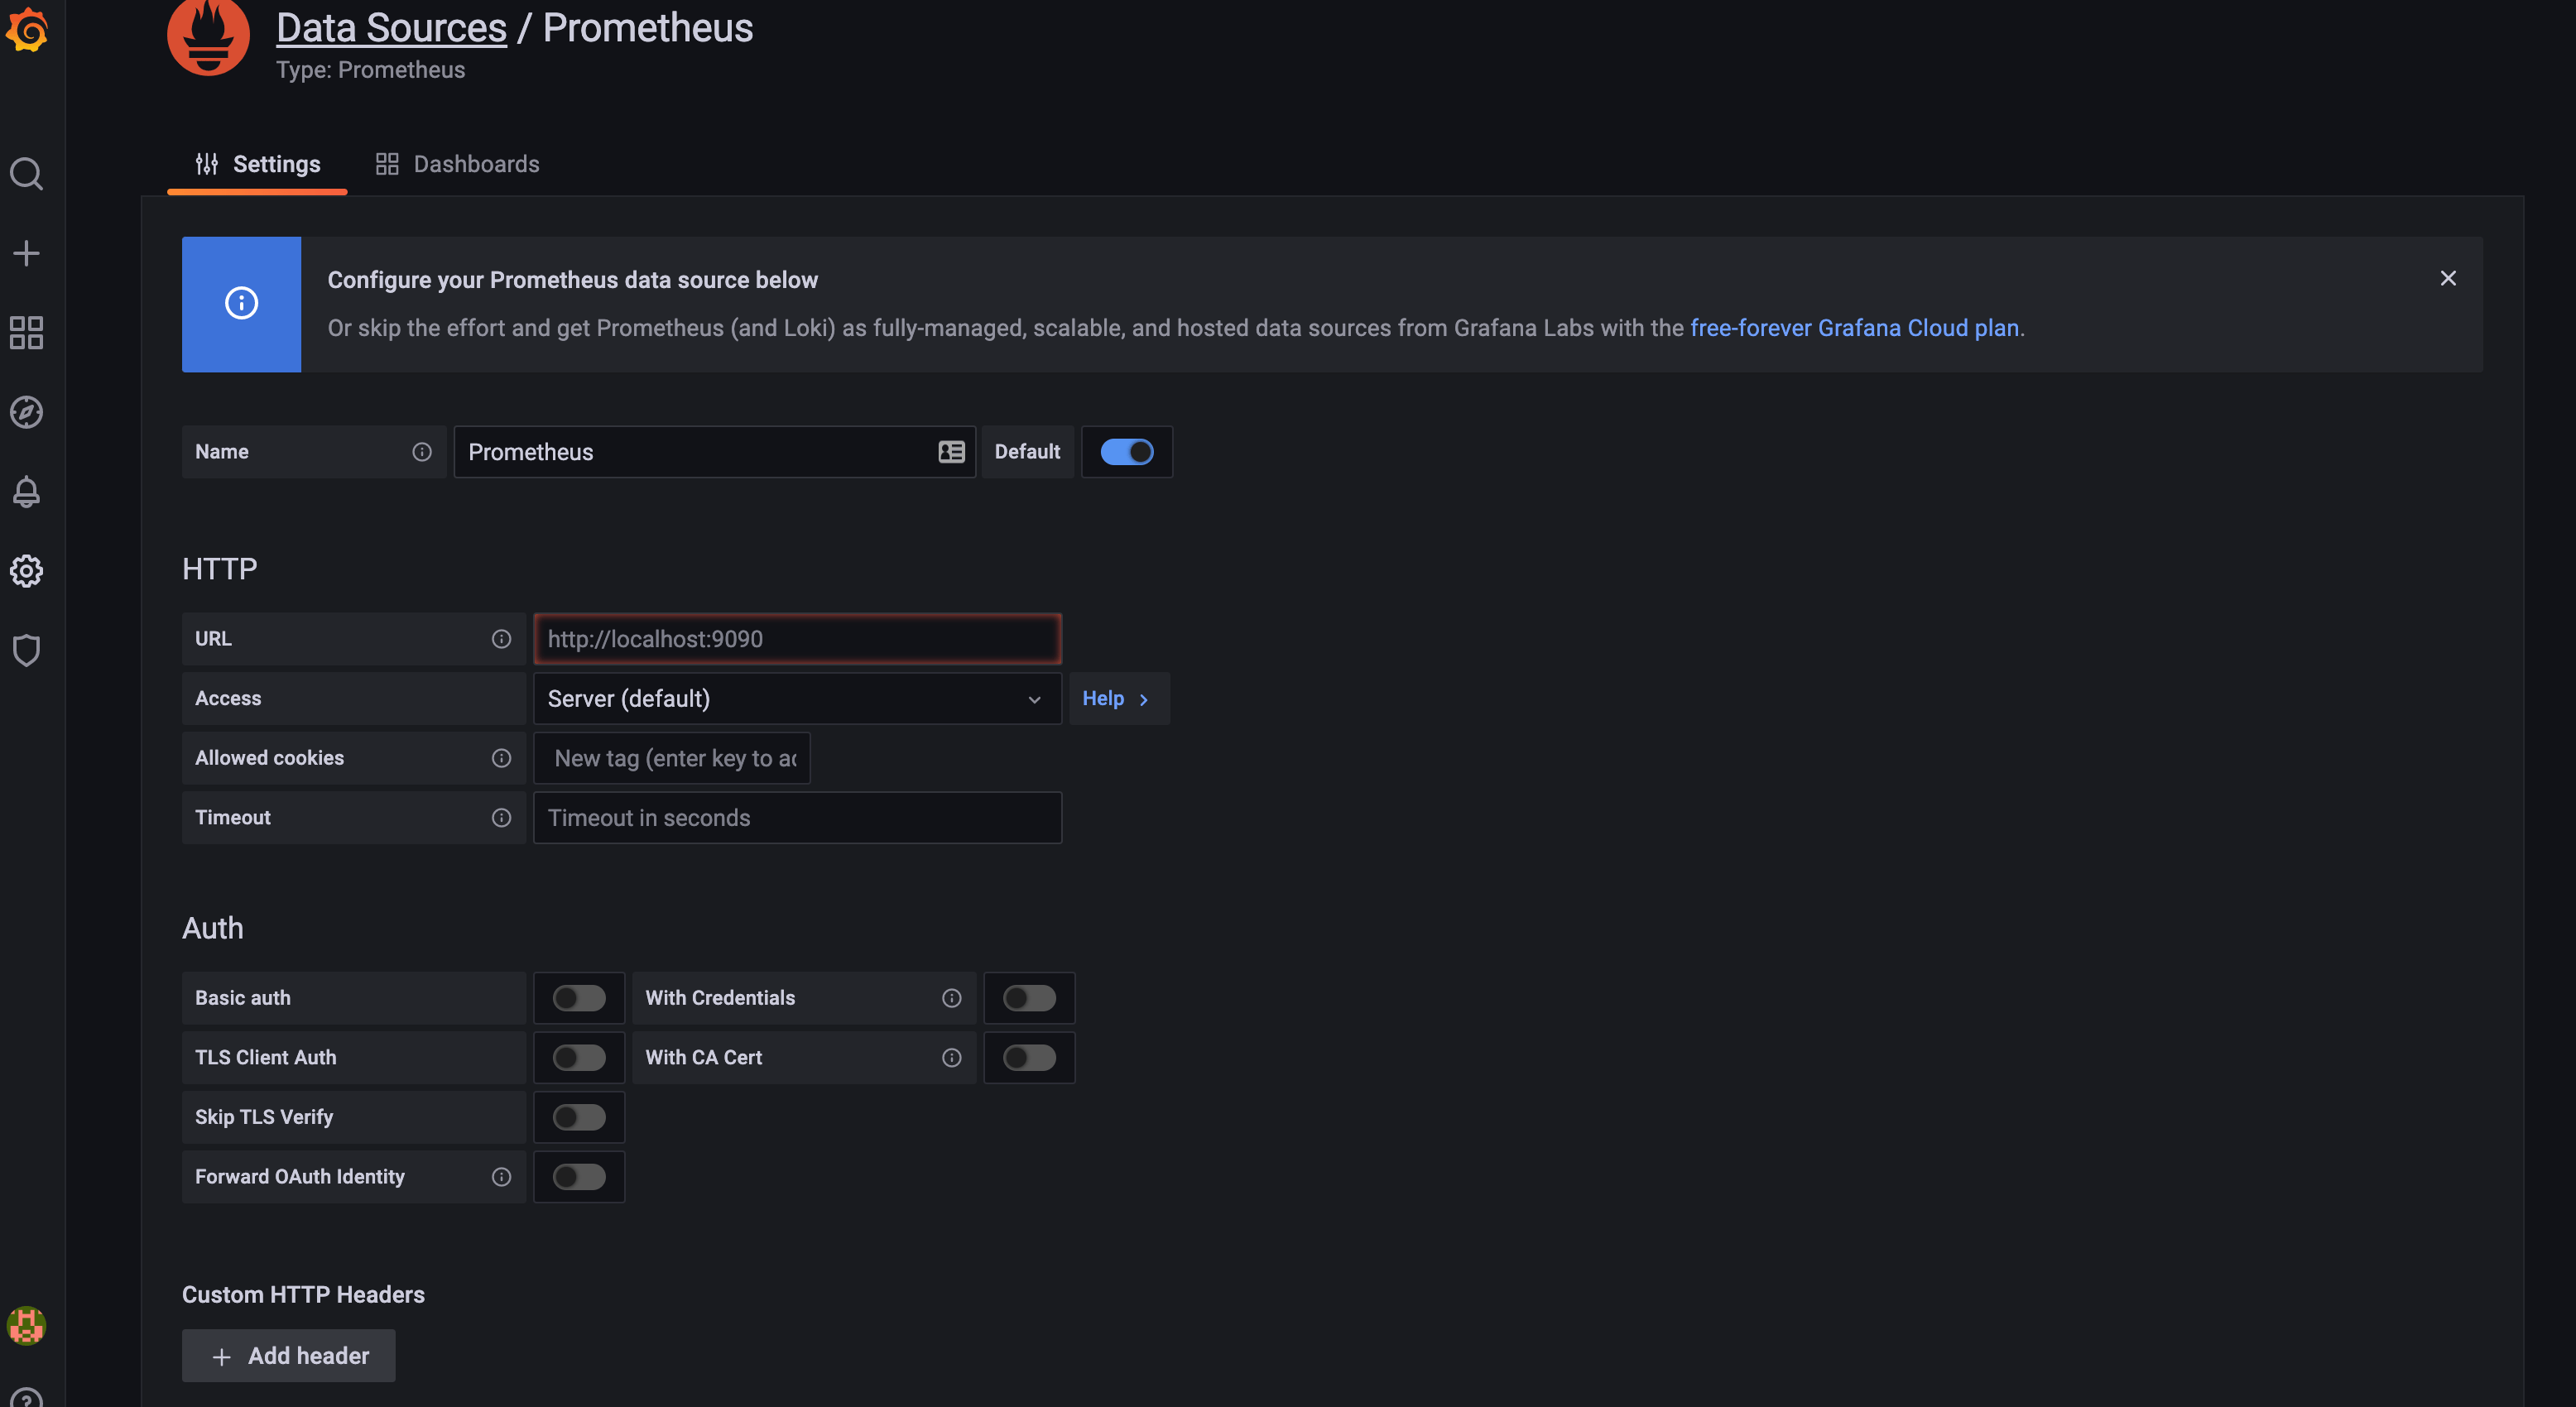
In the URL field, provide the URL for your Prometheus instance:
http://your_server_ip:9090/
Click on Save & test at the bottom of the screen. Now Prometheus is added as a data source for Grafana.
Next, you will import the MongoDB Overview dashboard for Grafana. You can import the dashboard by uploading a JSON file or by importing a dashboard ID, which you can find in the Grafana product documents for dashboards. Here, you will use the dashboard ID to import the dashboard.
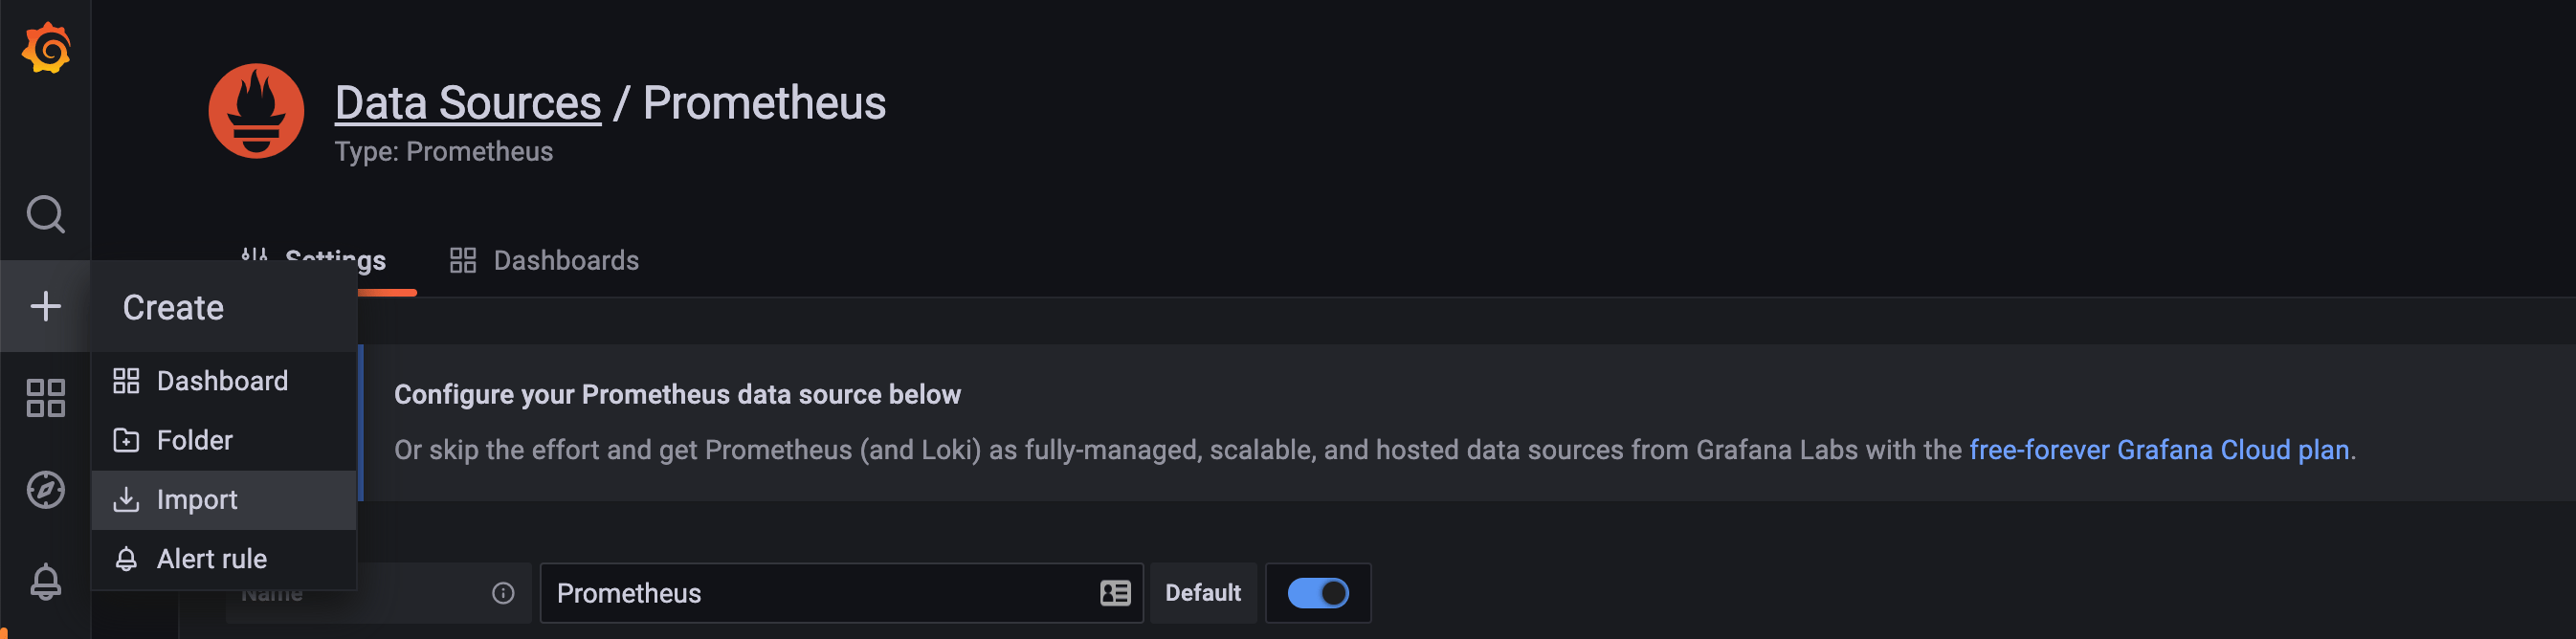
On the left menu, click the plus icon for Create and select Import. From there, you should be taken to the Import page:
Here, you can upload the JSON file of the dashboard or paste the Grafana Dashboard ID:
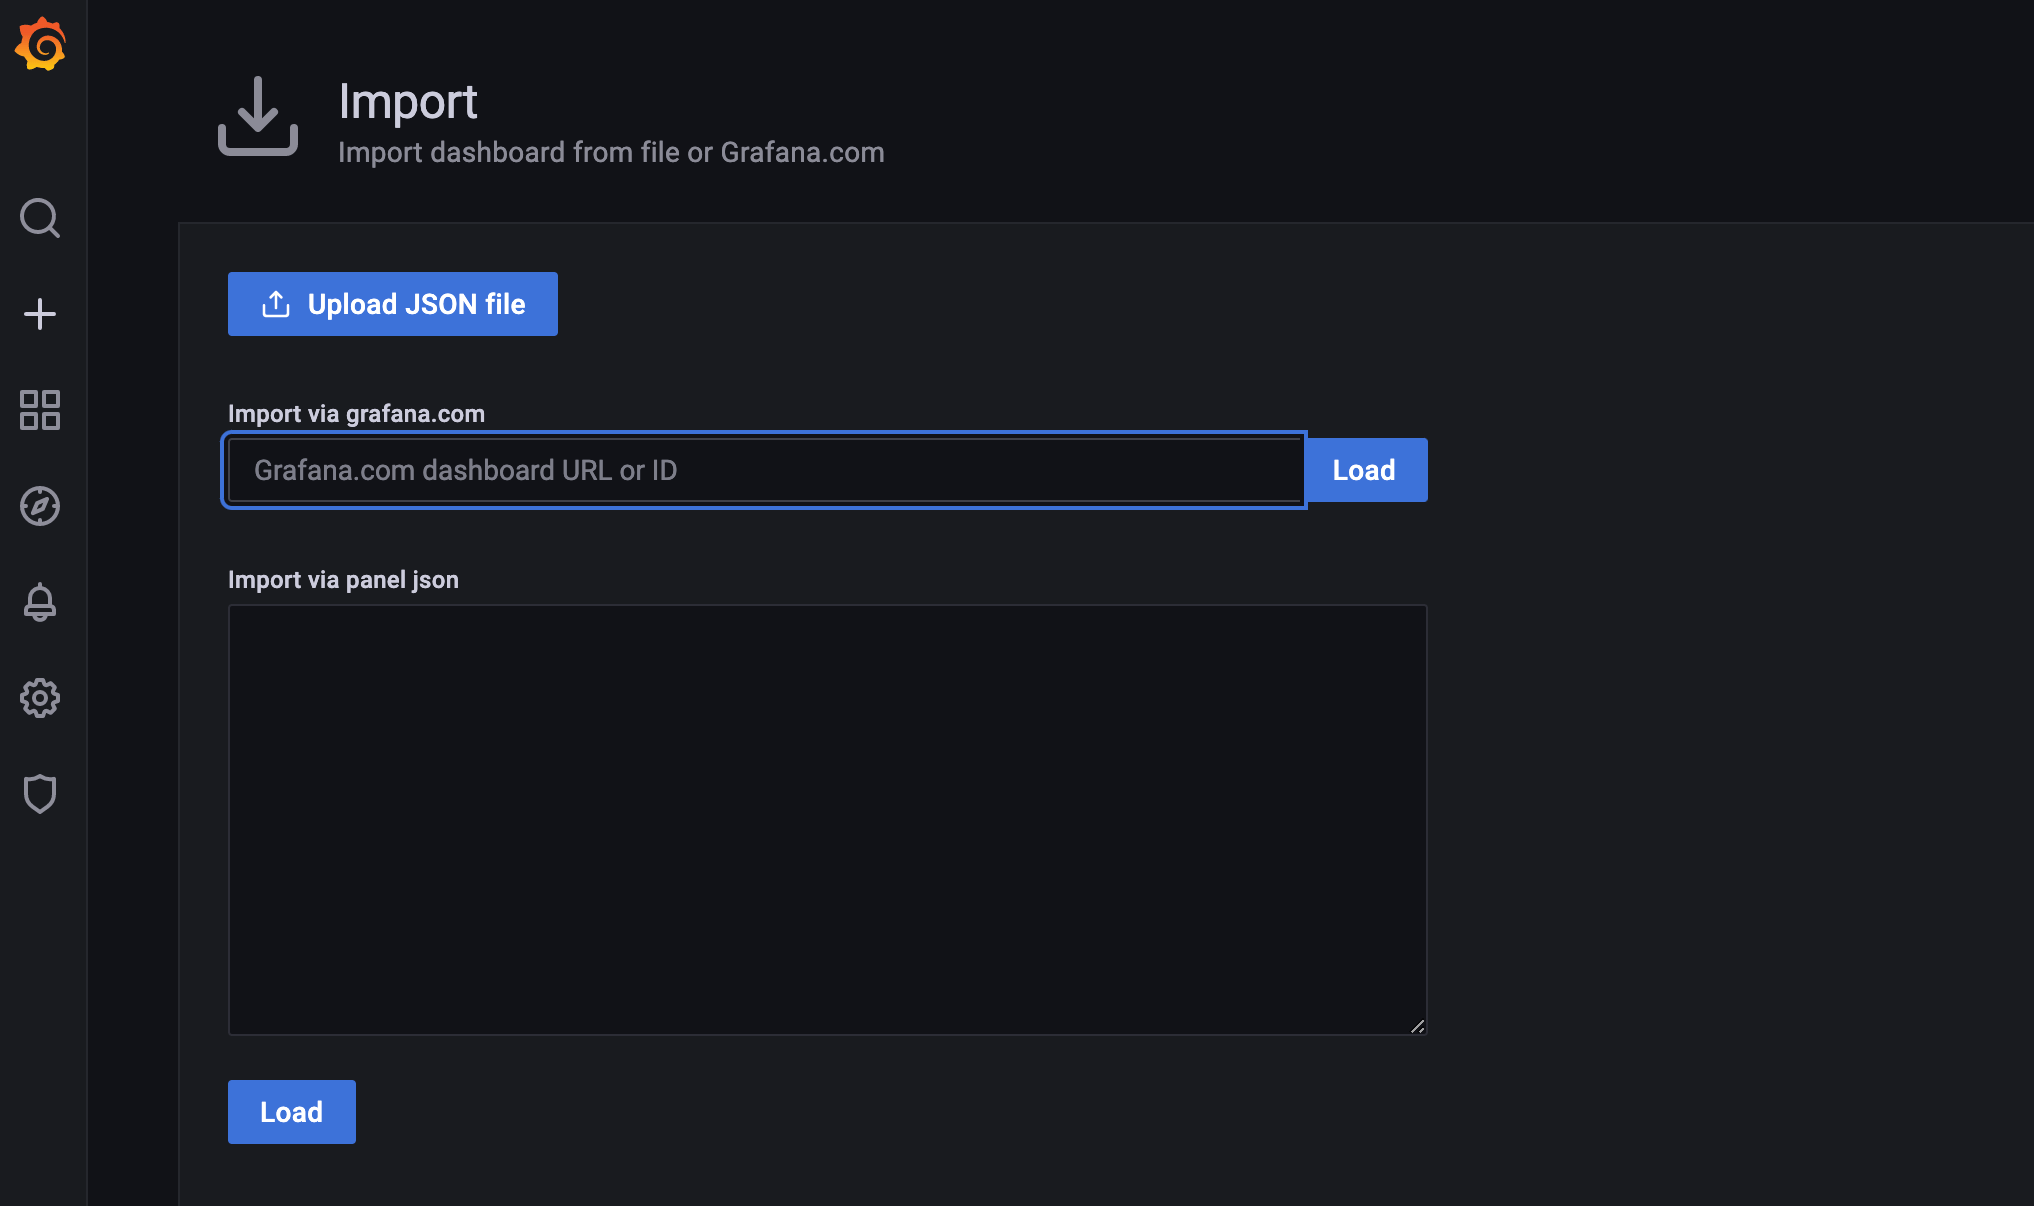
Add the Grafana dashboard ID, which you can find on the Grafana page for the MongoDB overview dashboard:
https://grafana.com/grafana/dashboards/7353
Many dashboards are available. You can find more by visiting the Grafana page on dashboards.
After adding the dashboard ID, click on Load.
Now an Options page will open, where you can provide a name for the dashboard, select the folder for the dashboard, and select a data source. You can leave the dashboard and folder names as the default. For the data source, choose Prometheus. Once you have filled in the options, click on Import.
The dashboard will be created:
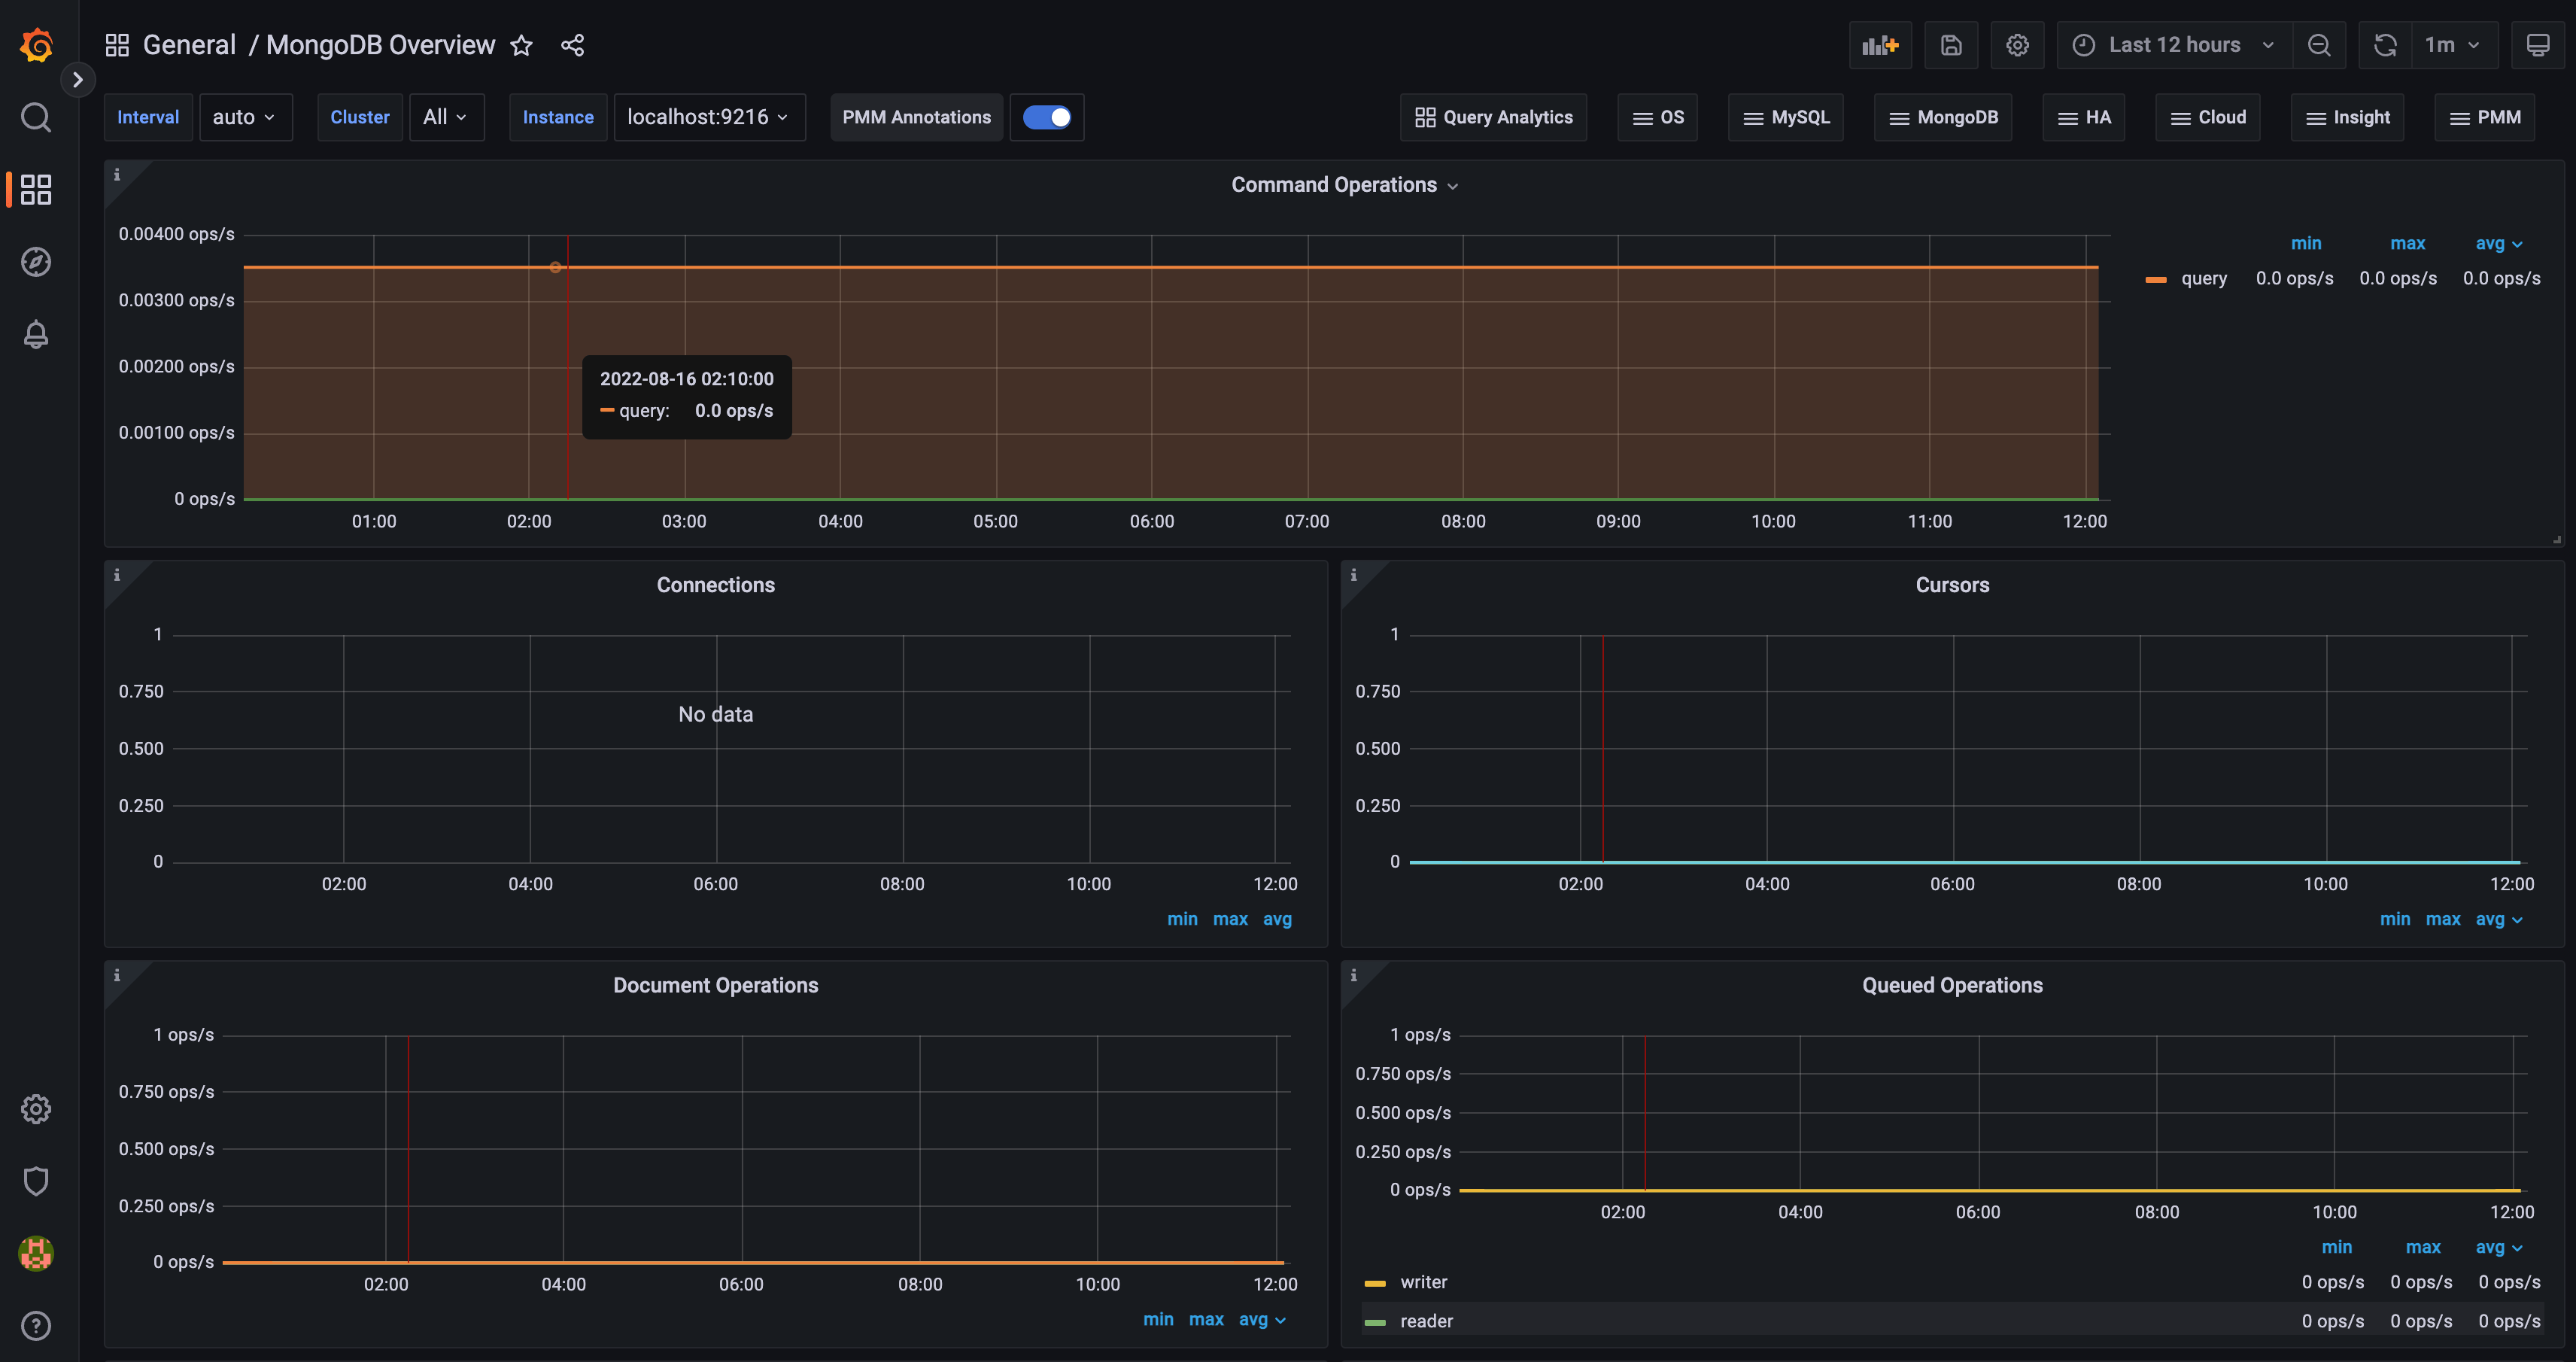
Your dashboard will show real-time updates of your MongoDB database, including command operations, connections, cursors, document operations, and queued operations. (For additional details, check out the Percona documentation for the MongoDB Overview dashboard.)
Conclusion
In this article, you set up a Grafana dashboard to monitor Prometheus metrics for your MongoDB database, which enables you to monitor your database via a GUI dashboard. First, you installed Prometheus and configured the MongoDB exporter. Then, you added Prometheus as a data source in Grafana, where you could monitor and visualize data from your MongoDB instance.
Now that you have a fully operational monitoring pipeline for MongoDB, you can dig a little deeper. To get started, try exploring additional dashboards in Grafana.
To learn more about MongoDB, check out our How To Manage Data with MongoDB tutorial series.
For a quick path to a fully working database environment, check out DigitalOcean’s MongoDB Managed Database.
Thanks for learning with the DigitalOcean Community. Check out our offerings for compute, storage, networking, and managed databases.
About the author(s)
Still looking for an answer?
This textbox defaults to using Markdown to format your answer.
You can type !ref in this text area to quickly search our full set of tutorials, documentation & marketplace offerings and insert the link!
 This work is licensed under a Creative Commons Attribution-NonCommercial- ShareAlike 4.0 International License.
Become a contributor for community
Get paid to write technical tutorials and select a tech-focused charity to receive a matching donation.

DigitalOcean Documentation
Full documentation for every DigitalOcean product.

Resources for startups and AI-native businesses
The Wave has everything you need to know about building a business, from raising funding to marketing your product.
The developer cloud
Scale up as you grow — whether you're running one virtual machine or ten thousand.

Start building today
From GPU-powered inference and Kubernetes to managed databases and storage, get everything you need to build, scale, and deploy intelligent applications.
