By Afaq Tariq and Sharon Campbell

An Article from Linux Dash
Introduction
Linux Dash is an open-source dashboard to monitor Linux servers. It prides itself on its simplicity and ease of use. It can be very handy to have a high-level dashboard for a server instance. With a wide array of modules for server statistics, it also serves as a great visual debugging tool.
-
Before installing the software, you can try the demo here.
-
At the time of writing, Linux Dash supports PHP on Apache and Nginx, Go, and Node.js. For this tutorial, we will be covering a PHP and Apache stack installation.
-
For information on installing on a different stack, please refer to the installation section of the GitHub Project.
Prerequisites
Please complete these prerequisites.
-
Add a sudo user
-
Follow this tutorial to install Apache and PHP on your Droplet. Please note that MySQL is not required for Linux Dash, so you may skip that section
-
Install Git if you plan to use the Git installation method
sudo apt-get install git
Step 1 — Installing Linux Dash
The following steps will install Linux Dash on your server.
First, you will need to SSH into your Droplet. See this DigitalOcean tutorial if you need directions.
Next, navigate to the web root directory.
cd /var/www/html/
Use Git to download Linux Dash.
sudo git clone https://github.com/afaqurk/linux-dash.git
Alternatively, for Composer, you can run
composer create-project afaqurk/linux-dash -s dev.
Make sure shell_exec is enabled. If this is a fresh Apache installation, it should be already.
sudo nano /etc/php5/apache2/php.ini
Locate the disable_functions line and make sure shell_exec and exec are not listed.
At this point, you should be able to visit http://your_server_ip/linux-dash and see the dashboard.
Step 2 — Password-Protecting the Dashboard
Linux Dash gives web access to private and sensitive information about your server. It is strongly suggested that you restrict access to this directory.
Follow these steps to password-protect Linux Dash. For more information on using the .htaccess file, please see this tutorial.
Open your Apache virtual hosts file for editing:
sudo nano /etc/apache2/sites-available/000-default.conf
Add a new Directory block for the linux-dash directory. This can be anywhere within the <VirtualHost *:80> block:
<Directory /var/www/html/linux-dash>
        Options FollowSymLinks
        AllowOverride All
        Order allow,deny
        allow from all
</Directory>
This enables the use of a .htaccess file. Now, create the .htaccess file in the Linux Dash directory:
sudo nano /var/www/html/linux-dash/.htaccess
Enable basic password authentication for this directory, and designate the password file:
AuthType Basic
AuthName "Restricted Files"
AuthUserFile /var/www/html/linux-dash/.htpasswd
Require valid-user
Create the password file with your chosen username and password.
sudo htpasswd -c /var/www/html/linux-dash/.htpasswd sammy
Enter your new password at the prompts:
New password:
Re-type new password:
Adding password for user sammy
Finally, restart Apache:
sudo service apache2 restart
If you refresh the page at http://your_server_ip/linux-dash, you should now be prompted for your credentials. Enter the ones you created in the previous step.
You should be able to see the Linux Dash application.
Step 3 — Using Linux Dash
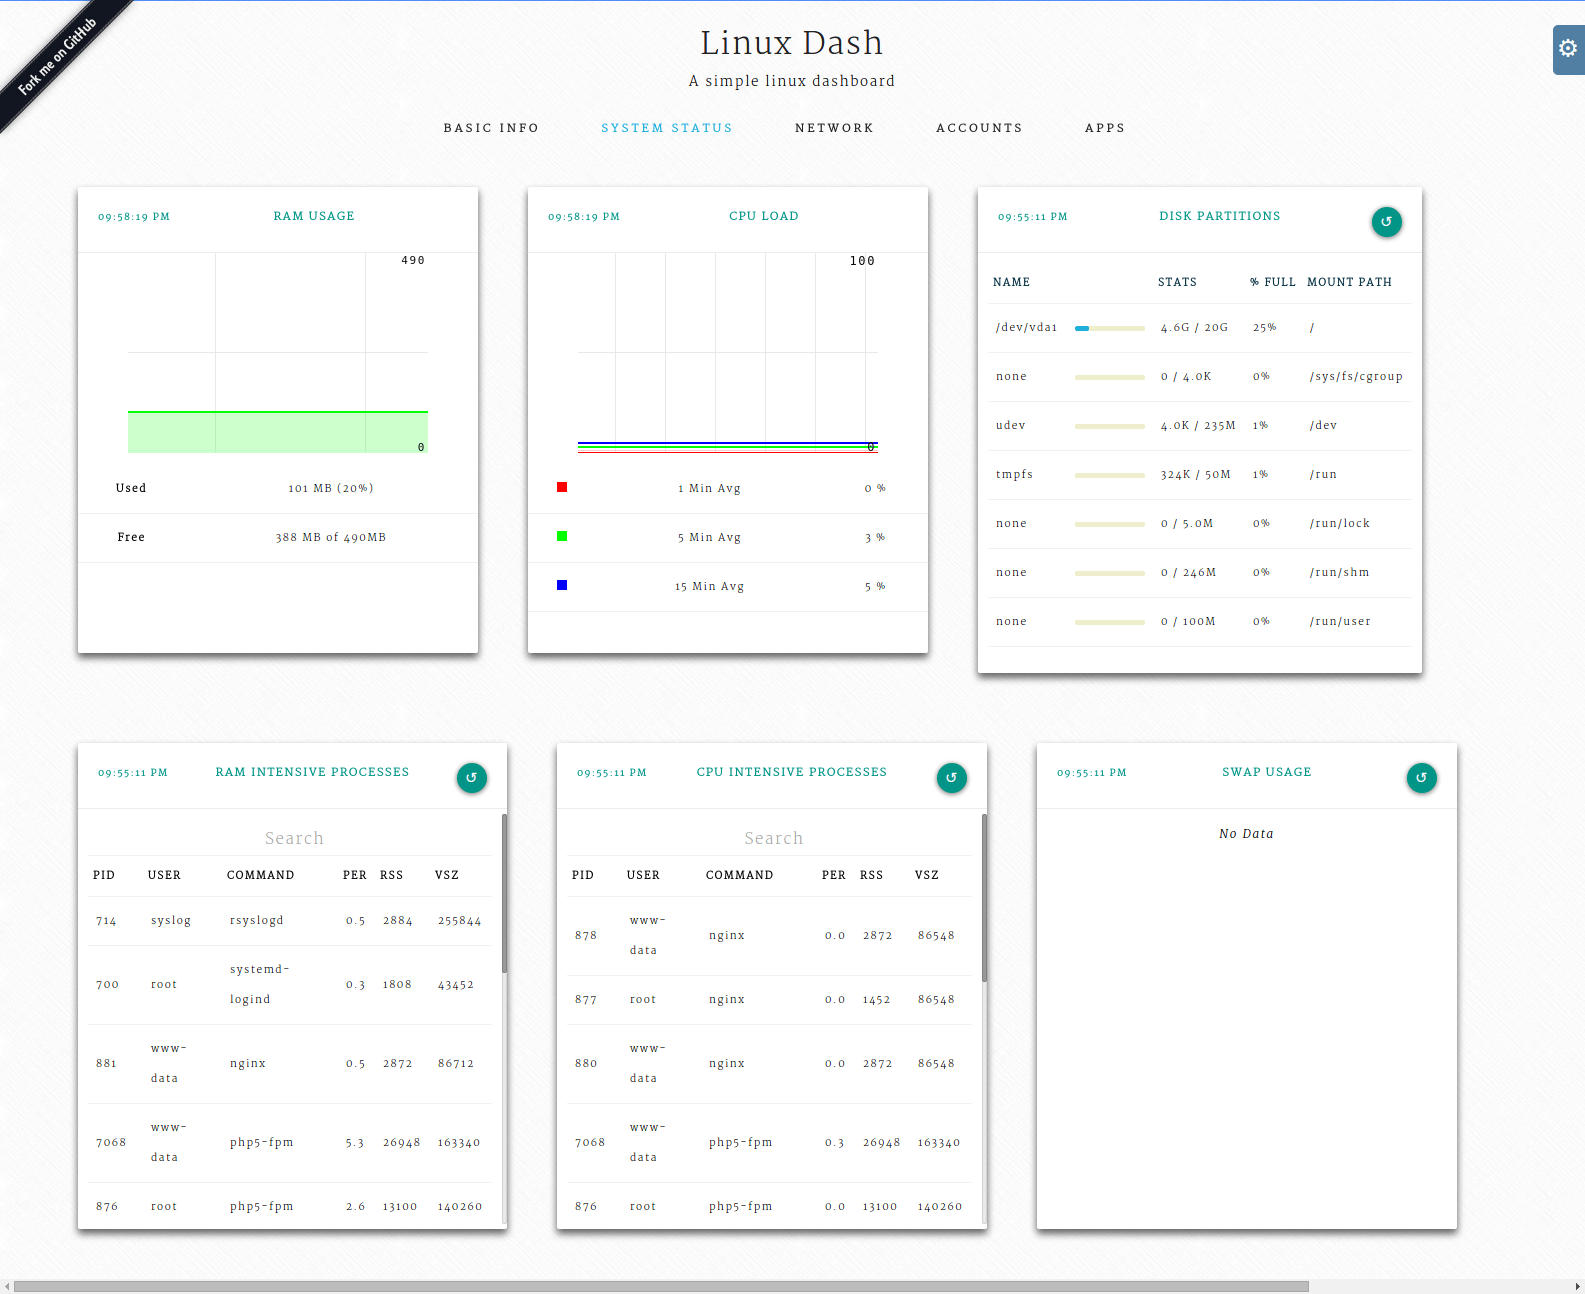
Linux Dash gives you a bird’s-eye view of your server.
There are five sections to Linux Dash in the menu near the top of the page. Each section contains an ever-growing number of modules which display information about the server. Some modules are simple readouts of common commands and files on your server, while others are detailed tables and charts.
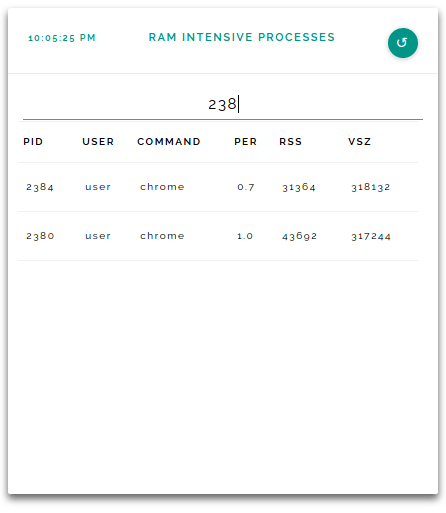
You can also filter the information inside a module using the search bar.
When debugging issues, Linux Dash can be a very useful tool.
For example, if a website or application on your Droplet is experiencing lag, you can investigate the SYSTEM STATUS section of Linux Dash. Here you can see CPU and RAM usage charts which show live information. If, for instance, the RAM chart shows unusually high usage, you can check the RAM INTENSIVE PROCESSES module on the next row to see which processes are struggling.
You can follow the same process for investigating high CPU usage as well.
Conclusion
Now you should have greater insight into your server’s status through the Linux Dash dashboard.
For support, please use the following resources:
- For general community support and questions, please see https://gitter.im/afaqurk/linux-dash
- To file a bug with the software, use the GitHub issues list
- To help build modules or extend Linux Dash features, fork the repo on GitHub
Thanks for learning with the DigitalOcean Community. Check out our offerings for compute, storage, networking, and managed databases.
About the author(s)
Current fan and former Editorial Manager at DigitalOcean. Hi! Expertise in areas including Ubuntu, Docker, Rails, and more.
Still looking for an answer?
 This work is licensed under a Creative Commons Attribution-NonCommercial- ShareAlike 4.0 International License.
Become a contributor for community
Get paid to write technical tutorials and select a tech-focused charity to receive a matching donation.

DigitalOcean Documentation
Full documentation for every DigitalOcean product.

Resources for startups and AI-native businesses
The Wave has everything you need to know about building a business, from raising funding to marketing your product.
The developer cloud
Scale up as you grow — whether you're running one virtual machine or ten thousand.

Start building today
From GPU-powered inference and Kubernetes to managed databases and storage, get everything you need to build, scale, and deploy intelligent applications.
