By Vadym Kalsin and Rachel Lee

The author selected the Open Source Initiative to receive a donation as part of the Write for DOnations program.
Docker is a popular application that simplifies managing application processes in containers. Containers are similar to virtual machines, but since they are more dependent on the host operating system, they are more portable and resource-friendly.
When using containers in a production environment, you should know if they are all running and what resources they are consuming. Zabbix is a monitoring system that can monitor the state of almost any element of your IT infrastructure, such as networks, servers, virtual machines, and applications.
Zabbix recently introduced a new agent (Zabbix agent 2) with advanced capabilities. One of the key advantages of the new agent is the ability to expand functionality using plugins. At the moment, there are several plugins available, including one for monitoring Docker.
In this tutorial, you will set up Docker monitoring in Zabbix using Zabbix agent 2 on Ubuntu 20.04. You’ll explore metrics and simulate a crash to generate a notification. In the end, you will have a monitoring system in place for your Docker application, which will notify you of any problems with containers.
Prerequisites
To follow this tutorial, you will need:
-
Two Ubuntu 20.04 servers set up by following the Initial Server Setup Guide for Ubuntu 20.04, including a non-root user with
sudoprivileges and a firewall configured withufw. -
The first server, where you’ll install Zabbix, will be the Zabbix server. Install the following components:
- Nginx, MySQL, and PHP, installed by following Steps 1 to 3 of the tutorial Ubuntu 20.04 LEMP Stack guide.
- Zabbix, installed by following Steps 1 to 5 of the tutorial How To Install and Configure Zabbix to Securely Monitor Remote Servers on Ubuntu 20.04.
- To receive notifications by mail (rather than the web interface), we recommend completing Step 8 of How To Install and Configure Zabbix to Securely Monitor Remote Servers on Ubuntu 20.04.
-
The second server, where you’ll install Docker (and the Zabbix agent), will be the Docker server. Install Docker by following Step 1 of the tutorial How To Install and Use Docker on Ubuntu 20.04.
-
A fully registered domain name. This tutorial will use
your_domainas an example throughout. You can purchase a domain name on Namecheap, get one for free on Freenom, or use the domain registrar of your choice. -
An A record with
your_domainpointing to your Zabbix server’s public IP address. You can follow this introduction to DigitalOcean DNS for details on how to add it.
Step 1 — Installing and Configuring Zabbix Agent 2
A Zabbix agent is a very small application that must be installed on every server or virtual machine you want to monitor. It will send monitoring data to the Zabbix server. Zabbiх suggests using one of two agents: Zabbix agent or Zabbix agent 2. (You can learn about their differences in the documentation.) For this tutorial, we’ll use Zabbix agent 2, since it can work with Docker. In this step, you will learn how to install and configure it.
Start by installing the agent software. Log in to the Docker server:
- ssh sammy@docker_server_ip_address
Run the following commands to install the repository configuration package:
- wget https://repo.zabbix.com/zabbix/5.0/ubuntu/pool/main/z/zabbix-release/zabbix-release_5.0-1+focal_all.deb
- sudo dpkg -i zabbix-release_5.0-1+focal_all.deb
Next, update the package index:
- sudo apt update
Then install the Zabbix agent:
- sudo apt install zabbix-agent2
Next, you will need to edit the agent configuration file, which contains all the agent’s settings. These settings specify the address to transfer data to, the port to use for connections to and from the server, whether to use a secure connection, and much more. In most cases, the default settings will be fine. All settings within this file are documented via informative comments throughout the file.
For this tutorial, you will need to edit the Zabbix agent settings to set up its connection to the Zabbix server. Open the agent configuration file in your text editor:
- sudo nano /etc/zabbix/zabbix_agent2.conf
By default, the agent is configured to send data to a server on the same host as the agent, so you will need to add the IP address of the Zabbix server. Find the following section:
...
### Option: Server
#       List of comma delimited IP addresses, optionally in CIDR notation, or DNS names of Zabbix servers and Zabbix proxies.
#       Incoming connections will be accepted only from the hosts listed here.
#       If IPv6 support is enabled then '127.0.0.1', '::127.0.0.1', '::ffff:127.0.0.1' are treated equally
#       and '::/0' will allow any IPv4 or IPv6 address.
#       '0.0.0.0/0' can be used to allow any IPv4 address.
#       Example: Server=127.0.0.1,192.168.1.0/24,::1,2001:db8::/32,zabbix.example.com
#
# Mandatory: yes, if StartAgents is not explicitly set to 0
# Default:
# Server=

Server=127.0.0.1
...
Change the default value to the IP of your Zabbix server:
...
Server=zabbix_server_ip_address
...
By default, the Zabbix server connects to the agent. But for some checks (for example, monitoring the logs), a reverse connection is required. For correct operation, you need to specify the Zabbix server address and a unique host name.
Find the section that configures the active checks and change the default values as shown below:
...
##### Active checks related

### Option: ServerActive
#       List of comma delimited IP:port (or DNS name:port) pairs of Zabbix servers and Zabbix proxies for active checks.
#       If port is not specified, default port is used.
#       IPv6 addresses must be enclosed in square brackets if port for that host is specified.
#       If port is not specified, square brackets for IPv6 addresses are optional.
#       If this parameter is not specified, active checks are disabled.
#       Example: ServerActive=127.0.0.1:20051,zabbix.domain,[::1]:30051,::1,[12fc::1]
#
# Mandatory: no
# Default:
# ServerActive=

ServerActive=zabbix_server_ip_address

### Option: Hostname
#       Unique, case sensitive hostname.
#       Required for active checks and must match hostname as configured on the server.
#       Value is acquired from HostnameItem if undefined.
#
# Mandatory: no
# Default:
# Hostname=

Hostname=Docker server
...
Save and close the file.
For the Zabbix agent to monitor Docker, you’ll need to add the zabbix user to the docker group:
- sudo usermod -aG docker zabbix
Now you can restart the Zabbix agent and set it to start at boot time:
- sudo systemctl restart zabbix-agent2
- sudo systemctl enable zabbix-agent2
For good measure, check that the Zabbix agent is running correctly:
- sudo systemctl status zabbix-agent2
The output will look similar to this, indicating that the agent is running:
Output● zabbix-agent2.service - Zabbix Agent 2
     Loaded: loaded (/lib/systemd/system/zabbix-agent2.service; enabled; vendor preset: enabled)
     Active: active (running) since Fri 2021-09-03 07:05:05 UTC; 1min 23s ago
  ...
The agent will listen on port 10050 for connections from the server. Configure UFW to allow connections to this port:
- sudo ufw allow 10050/tcp
You can learn more about UFW in How To Set Up a Firewall with UFW on Ubuntu 20.04.
In this step, you installed Zabbix agent 2, configured it to allow connections from your Zabbix server, and prepared to monitor Docker.
Your agent is now ready to send data to the Zabbix server. But in order to use it, you have to link to it from the server’s web console and enable the Docker template. In the next step, you will complete the configuration.
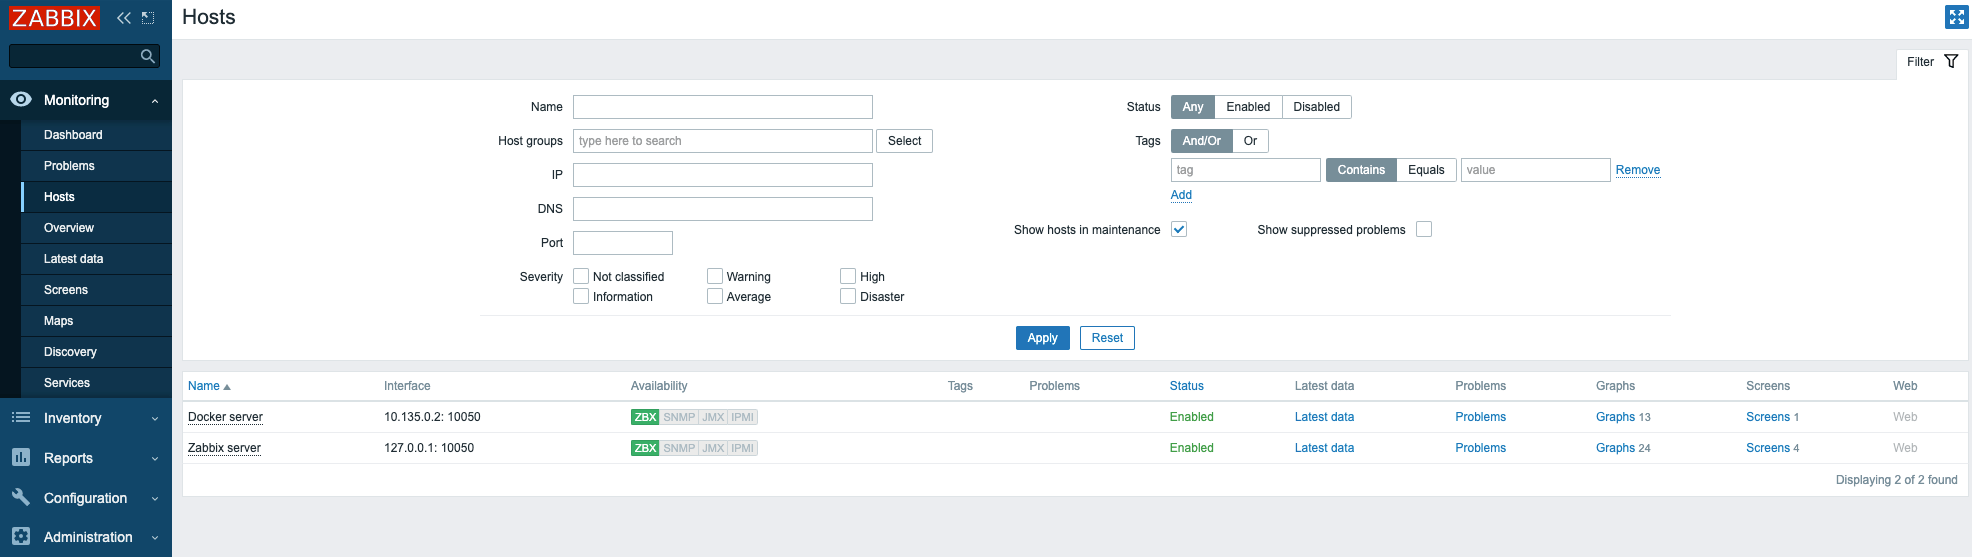
Step 2 — Adding the New Host to the Zabbix Server
Installing an agent on the server you want to monitor is only half of the process. Each host you want to monitor needs to be registered on the Zabbix server, which you can do through the web interface. You also need to connect the appropriate template to it. Using templates, you can apply the same monitoring items, triggers, graphs, and low-level discovery rules to multiple hosts. When a template is linked to a host, all entities (items, triggers, graphs, etc.) of the template are added to the host.
Log in to the Zabbix server web interface by navigating to the address http://zabbix_server_name or https://zabbix_server_name. (As mentioned in the tutorial linked in the prerequisites, How To Install and Configure Zabbix to Securely Monitor Remote Servers on Ubuntu 20.04, the default user is Admin and the password is zabbix.)
When you have logged in, click Configuration and then Hosts in the left navigation bar. Then click the Create host button in the top right corner of the screen. This will open the host configuration page.
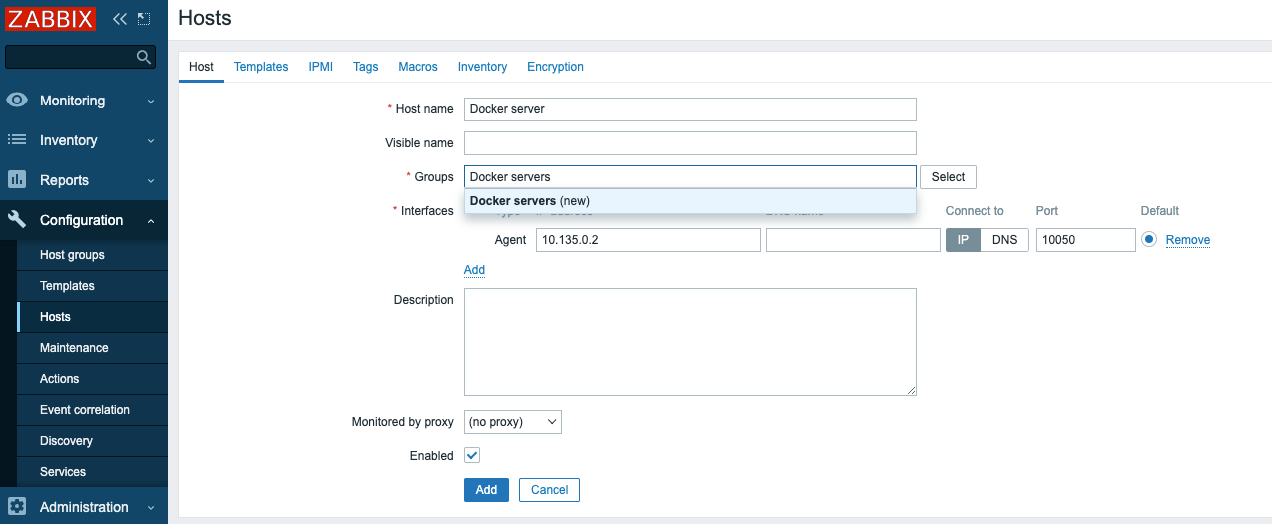
Adjust the Host name and IP address to reflect the host name and IP address of your Docker server, then add the host to a group. You can select an existing group, such as Linux servers, or create your own group, such as Docker servers. Each host must be in a group and it can also be in multiple groups. To do this, enter the name of an existing or new group in the Groups field and select the desired value from the proposed list.
After adding the group, click the Templates tab.
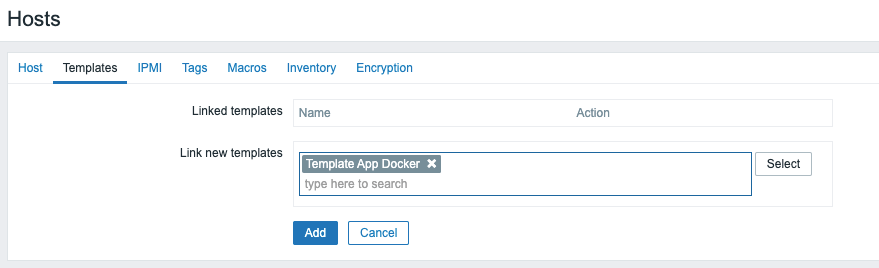
To enable the necessary checks, you need to add a template. The template includes all the necessary checks, triggers, and graphs. The host can have multiple templates. To do this, enter the name of the template in the Search field and select it from the proposed list.
For this tutorial, type Template App Docker and then select it from the list to add this template to the host. This will attach to the host all the items, triggers, and graphs required for Docker monitoring that were pre-configured in the template.
Finally, click the Add button at the bottom of the form to create the host.
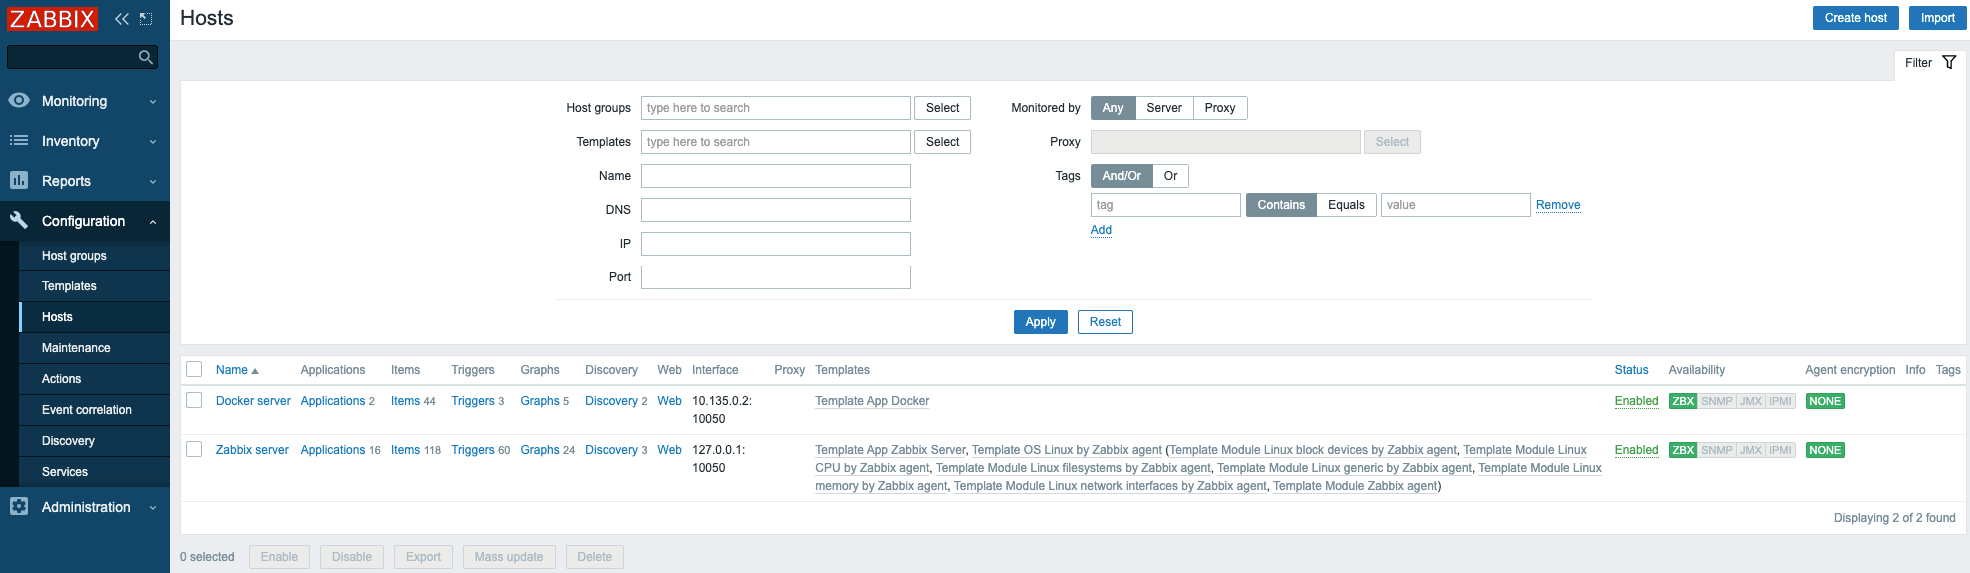
You will see your new host in the list. Wait for a minute and reload the page to see green labels indicating that everything is working fine.
In this step, you added a new host to the server and used ready-made templates to add the required checks.
The Zabbix server is now monitoring your Docker server. In the next step, you will launch a test container and explore what metrics Zabbix can collect.
Step 3 — Accessing Docker Metrics
If you are running this tutorial in a new environment, then you have no containers running and nothing to monitor yet. In this step, you will start a test container and see what metrics are available. In this tutorial, you will run a test container based on ubuntu.
Run the following command on the Docker server:
- sudo docker run --name test_container -it ubuntu bash
This will launch a test container named test_container using the ubuntu:latest image. The -it flag instructs Docker to allocate a pseudo-TTY connected to the container’s standard input, creating an interactive bash shell in the container.
The output will look similar to this:
OutputUnable to find image 'ubuntu:latest' locally
latest: Pulling from library/ubuntu
35807b77a593: Pull complete
Digest: sha256:9d6a8699fb5c9c39cf08a0871bd6219f0400981c570894cd8cbea30d3424a31f
Status: Downloaded newer image for ubuntu:latest
Note: Do not leave the shell, as you will need it in the next step.
A couple of minutes after starting the container, Zabbix will automatically find a new container and add the appropriate metrics.
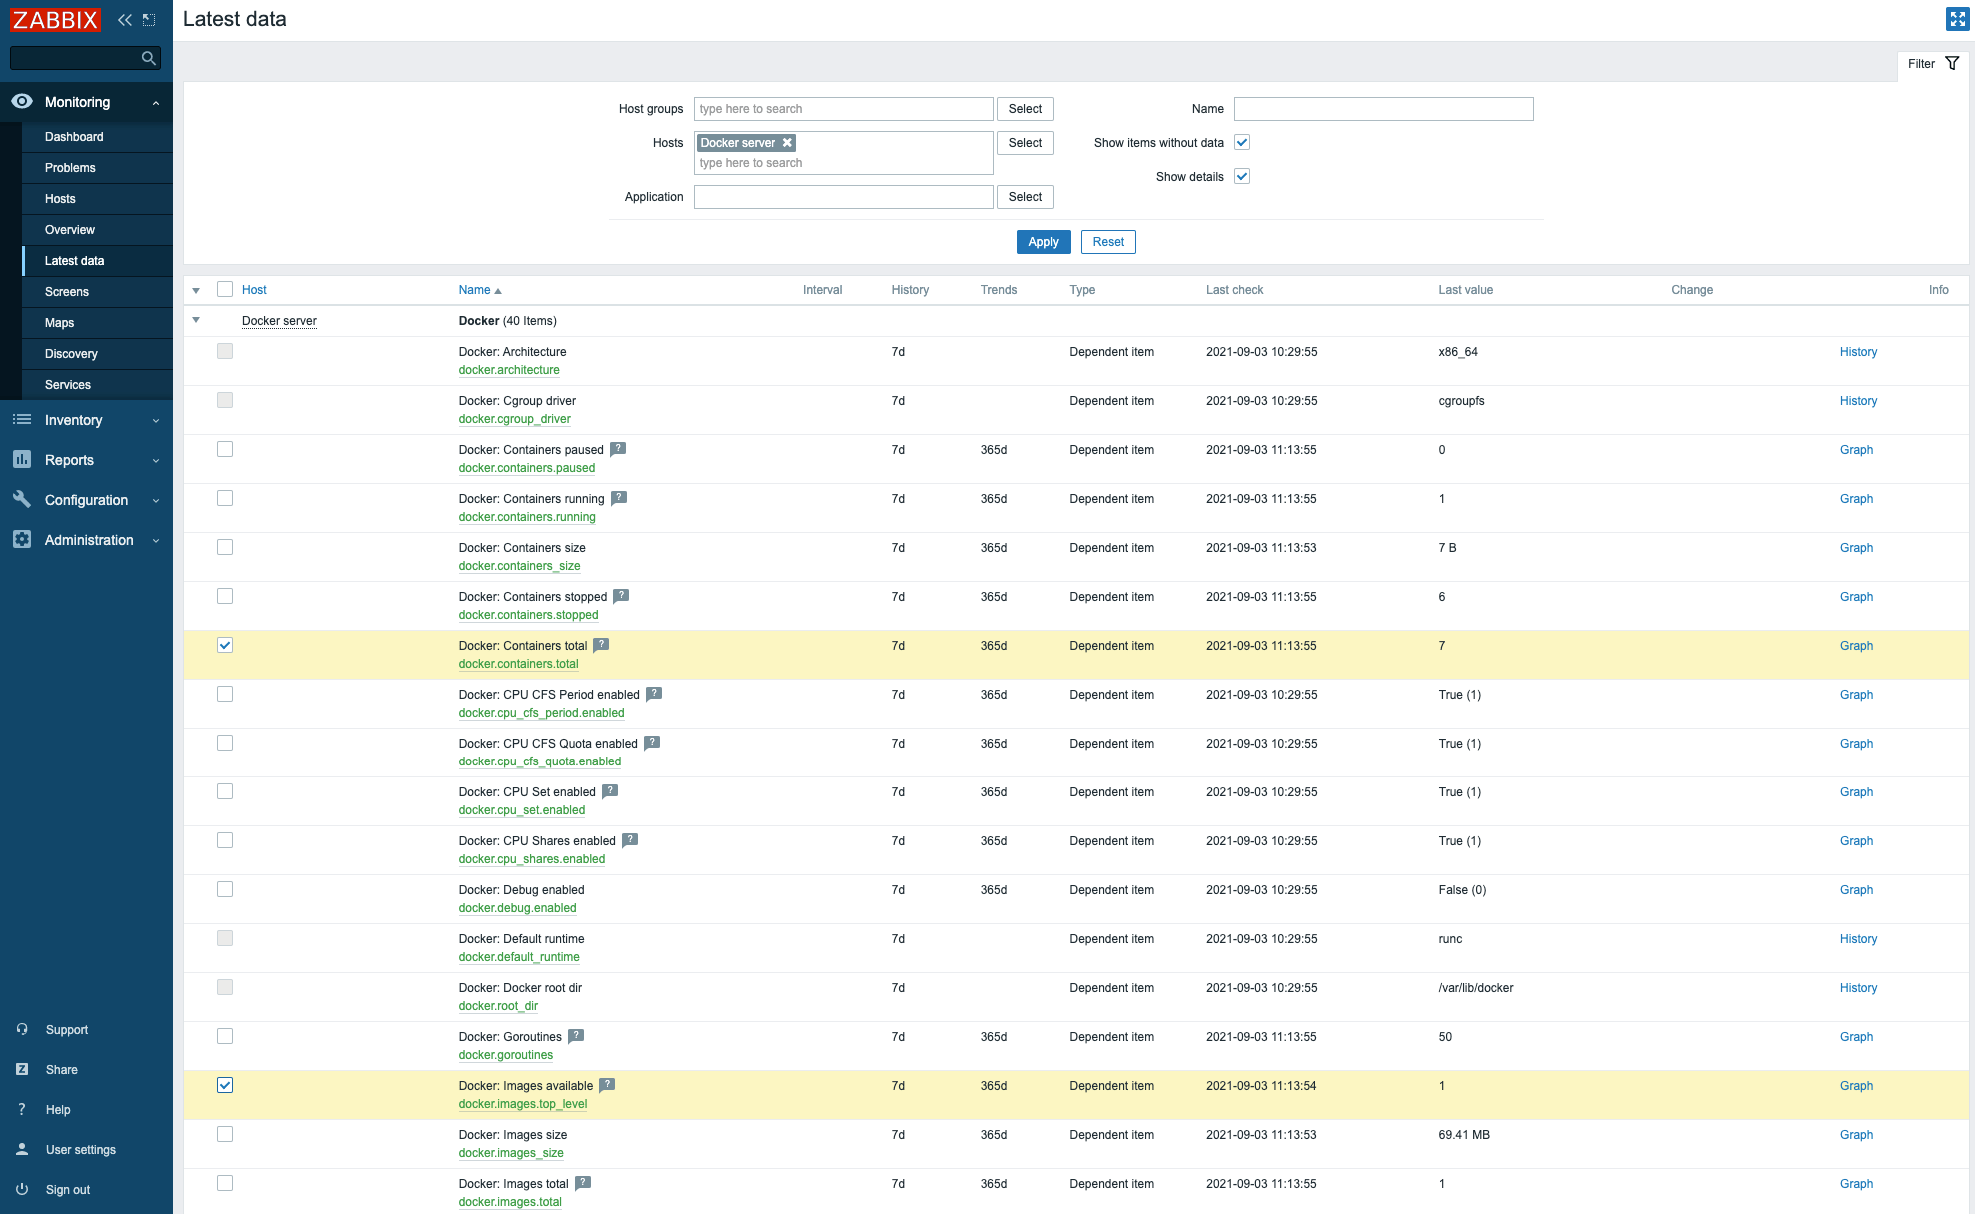
To see a list of all metrics, click Monitoring and then Hosts in the left navigation bar. Then click Latest data in the corresponding line.
You will see a table with all the metrics that the Zabbix agent collects for a given host. For each item, you can see the name, the history storage period, the time of the last check, and the last value.
You can scroll through the list and see the metrics associated with the test_container. You can also enter the name of the container in the Name field and click Apply to find all the relevant metrics.
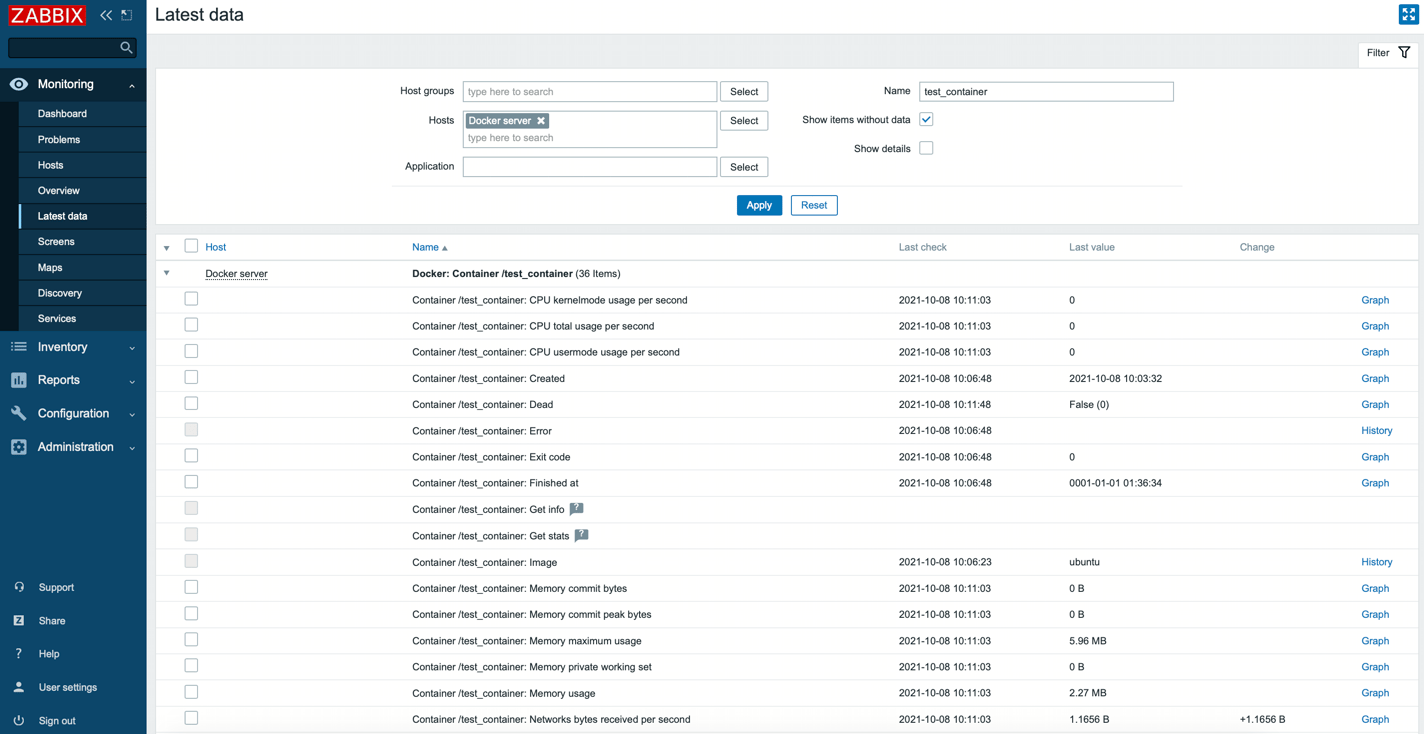
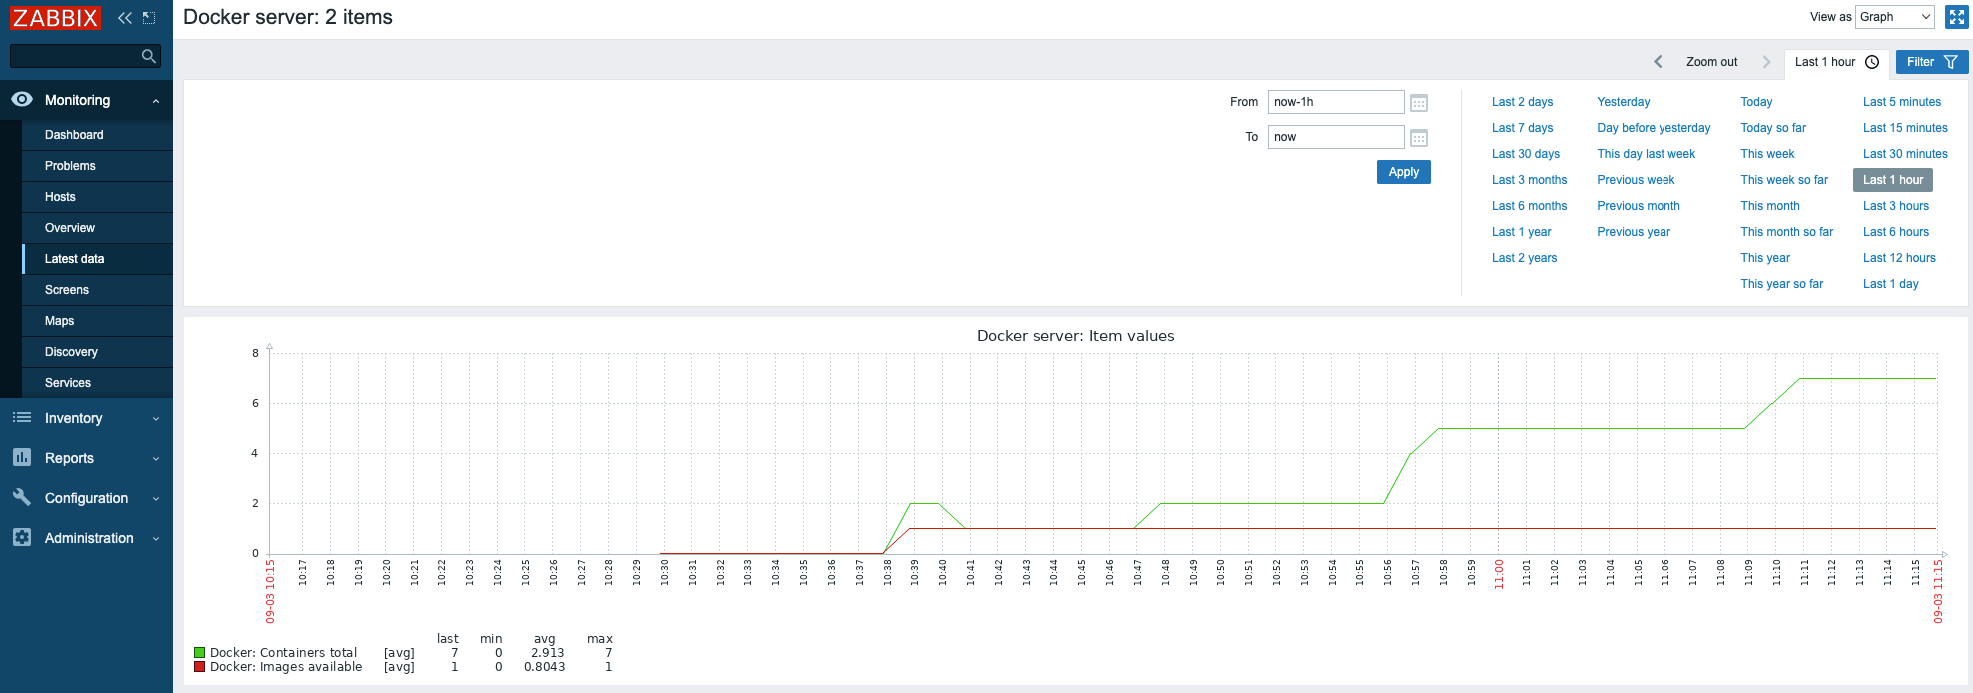
To view the history of changes for a specific metric, click Graph (for numerical values) or History (for text values).
You can also select one or more metrics in the list and click the Display graph button at the very bottom of the list to see several graphs together.
In this step, you launched a test container and viewed its metrics in the Zabbix web interface. Next, you will trigger a notification.
Step 4 — Generating a Test Alert
In this step, you’ll see how monitoring works by simulating an unexpected shutdown of the container, which triggers a notification from Zabbix.
Begin by simulating a container crash. Execute the following command in the container shell:
- exit 1
With this command, you terminated the container with error code 1. This exit code is passed on to the caller of docker run, and is recorded in the test container’s metadata.
To see the alert, click Monitoring and then Dashboard in the left navigation bar of the Zabbix web interface. In a minute or less, you will see the notification “Container has been stopped with error code”:
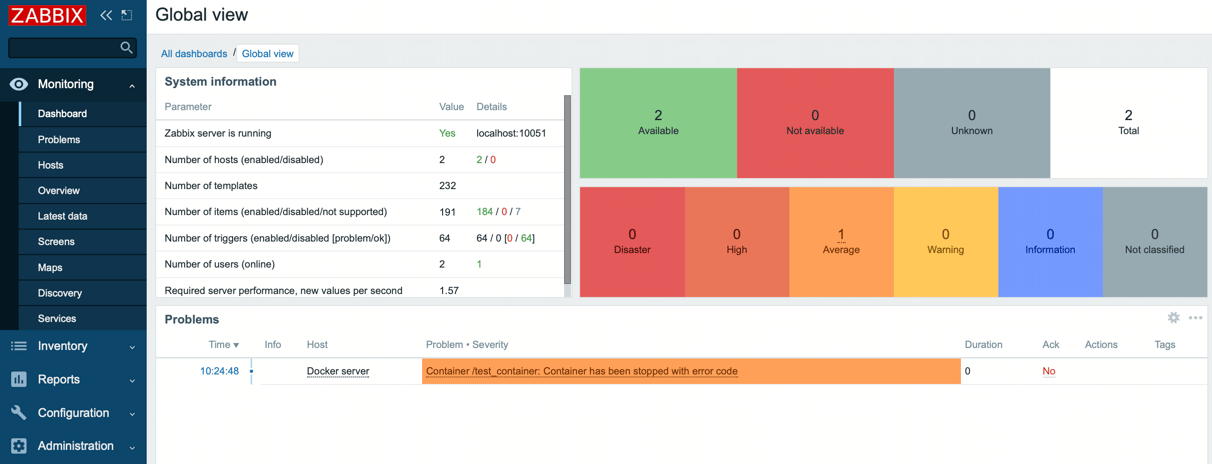
If you have previously configured email or other notifications, you will also receive a message similar to this:
Problem started at 11:17:31 on 2021.09.03
Problem name: Container /test_container: Container has been stopped with error code
Host: Docker Server
Severity: Average
Operational data: 1
Original problem ID: 103
After checking the notifications, you can restart the container and the problem will disappear automatically.
To restart the container, run the following command on the Docker server.
- sudo docker start test_container
You can check that the container is running with this command:
- sudo docker ps
The output will look similar to this:
OutputCONTAINER ID   IMAGE     COMMAND   CREATED          STATUS         PORTS     NAMES
c9b8a264c2e1   ubuntu    "bash"    23 minutes ago   Up 7 seconds             test_container
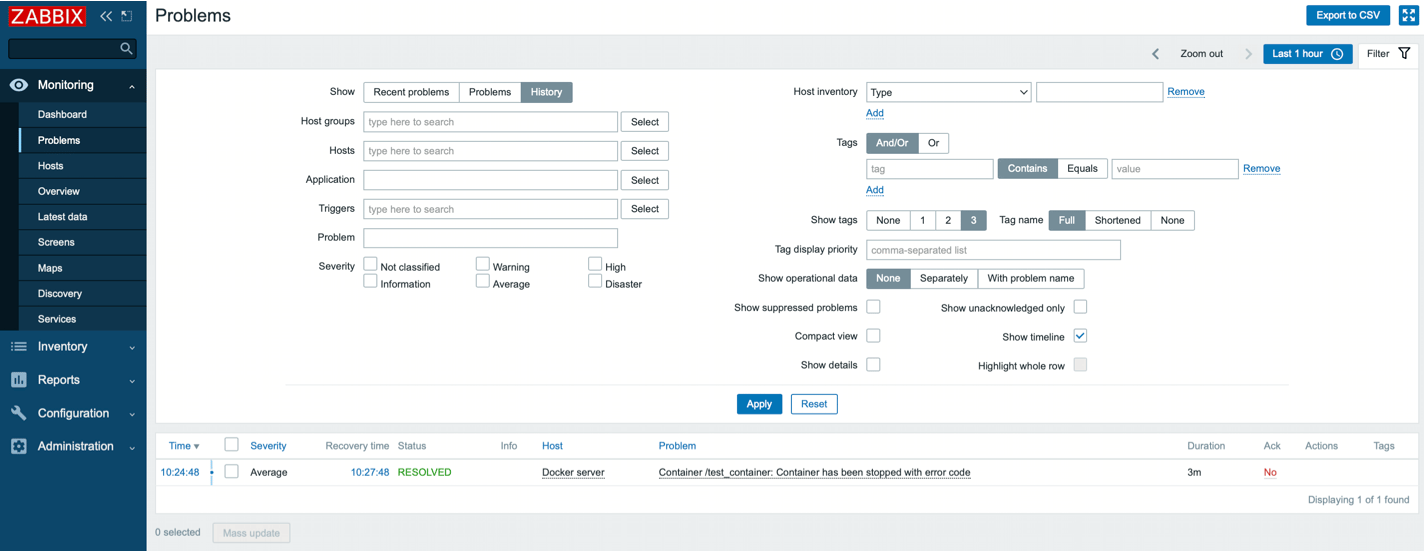
To see the history of all alerts in the Zabbix interface, click Monitoring and then Problems in the left navigation bar. You can use options and filters to see events for a specific period of time, for specific hosts, etc. To view history, select the option Show: History
In this step, you simulated a container crash and received a notification in Zabbix.
Conclusion
In this tutorial, you learned how to set up a simple monitoring solution to help you track the health of your Docker containers. Now it can alert you to problems and you can analyze the processes taking place in your Docker application.
With Zabbix, you can monitor not just containers, but also servers, databases, web applications, and much more using ready-made Zabbix official templates.
To learn more about monitoring infrastructure, check out our Monitoring topic page.
Thanks for learning with the DigitalOcean Community. Check out our offerings for compute, storage, networking, and managed databases.
About the author(s)
Monitoring engineer
Still looking for an answer?
 This work is licensed under a Creative Commons Attribution-NonCommercial- ShareAlike 4.0 International License.
Become a contributor for community
Get paid to write technical tutorials and select a tech-focused charity to receive a matching donation.

DigitalOcean Documentation
Full documentation for every DigitalOcean product.

Resources for startups and AI-native businesses
The Wave has everything you need to know about building a business, from raising funding to marketing your product.
The developer cloud
Scale up as you grow — whether you're running one virtual machine or ten thousand.

Start building today
From GPU-powered inference and Kubernetes to managed databases and storage, get everything you need to build, scale, and deploy intelligent applications.
