By Joe Morgan and Timothy Nolan

The author selected Creative Commons to receive a donation as part of the Write for DOnations program.
Introduction
Since React apps are made to scale and grow quickly, it’s easy for subtle bugs to infiltrate your code. The React Developer Tools browser extension can help you track down these bugs by giving you more insight into the current state for each component. React Developer Tools gives you an interface for exploring the React component tree along with the current props, state, and context for individual components. React Developer Tools also lets you determine which components are re-rendering and can generate graphs to show how long individual components take to render. You can use this information to track down inefficient code or to optimize data-heavy components.
This tutorial begins by installing the React Developer Tools browser extension. You’ll then build a text analyzer as a test application, which will take a block of text and display information such as word count, character count, and character usage. Finally, you will use React Developer Tools to explore the text analyzer’s components and keep track of the changing props and context. The examples will use the Chrome browser, but you can also use the plugin for Firefox.
By the end of this tutorial, you’ll be able to start using the React Developer Tools to debug and explore any React project.
Prerequisites
-
To use the Chrome React Developer Tools extension, you will need to download and install the Google Chrome web browser or the open-source Chromium web browser. You can also following along using the React Developer Tools FireFox plugin for the FireFox web browser.
-
You will need a development environment running Node.js; this tutorial was tested on Node.js version 10.22.0 and npm version 6.14.6. To install this on macOS or Ubuntu 18.04, follow the steps in How to Install Node.js and Create a Local Development Environment on macOS or the Installing Using a PPA section of How To Install Node.js on Ubuntu 18.04.
-
A React development environment set up with Create React App. To set this up, follow Step 1 — Creating an Empty Project of the How To Manage State on React Class Components tutorial, which will remove the non-essential boilerplate. This tutorial will use
debug-tutorialas the project name. -
You will be using React components and Hooks in this tutorial, including the
useStateand context Hooks. You can learn about components and Hooks in our tutorials How To Create Custom Components in React, How To Manage State with Hooks on React Components, and How To Share State Across React Components with Context. -
You will also need a basic knowledge of JavaScript and HTML, which you can find in our How To Build a Website with HTML series and in How To Code in JavaScript. Basic knowledge of CSS would also be useful, which you can find at the Mozilla Developer Network.
Step 1 — Installing the React Developer Tools Extension
In this step, you’ll install the React Developer Tools broswer extension in Chrome. You’ll use the developer tools in the Chrome JavaScript console to explore the component tree of the debug-tutorial project you made in the Prerequisites. This step will use Chrome, but the steps will be nearly identical for installing the React Developer Tools as an add-on in Firefox.
By the end of this step, you’ll have the React Developer Tools installed in your browser and you’ll be able to explore and filter components by name.
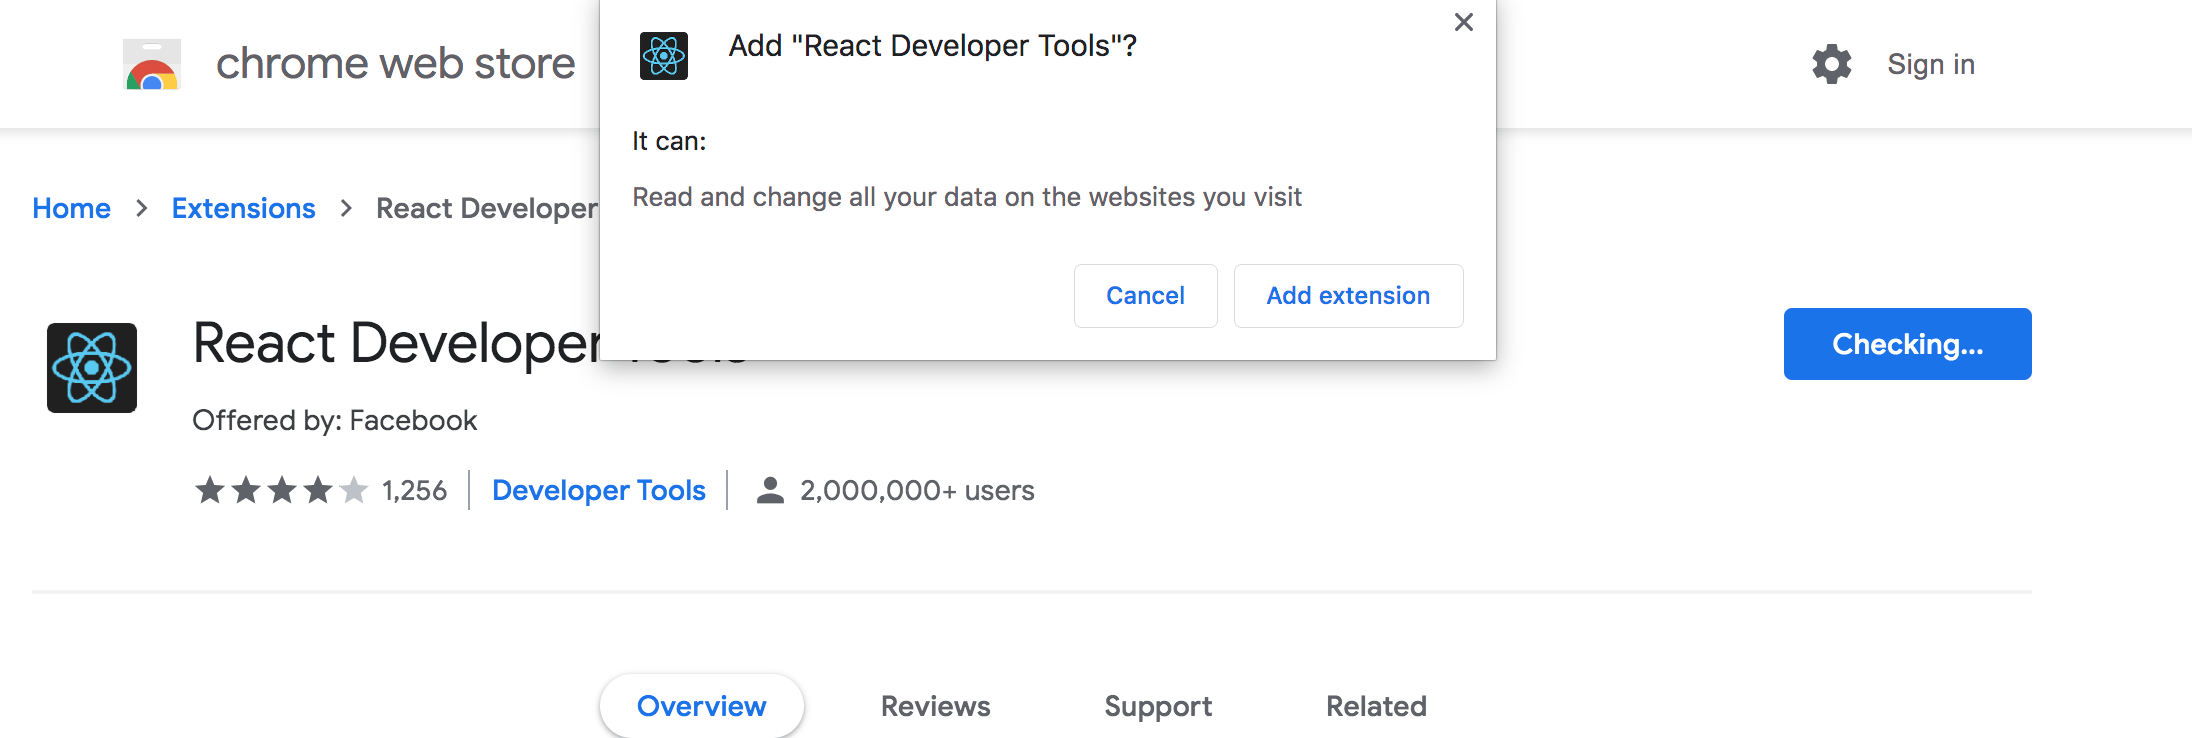
The React Developer Tools is a plugin for the Chrome and Firefox browser. When you add the extension, you are adding additional tools to the developer console. Visit the Chrome plugin page for React Developer Tools to install the extension.
Click on the Add to Chrome button. Then click on the Add extension button to confirm:
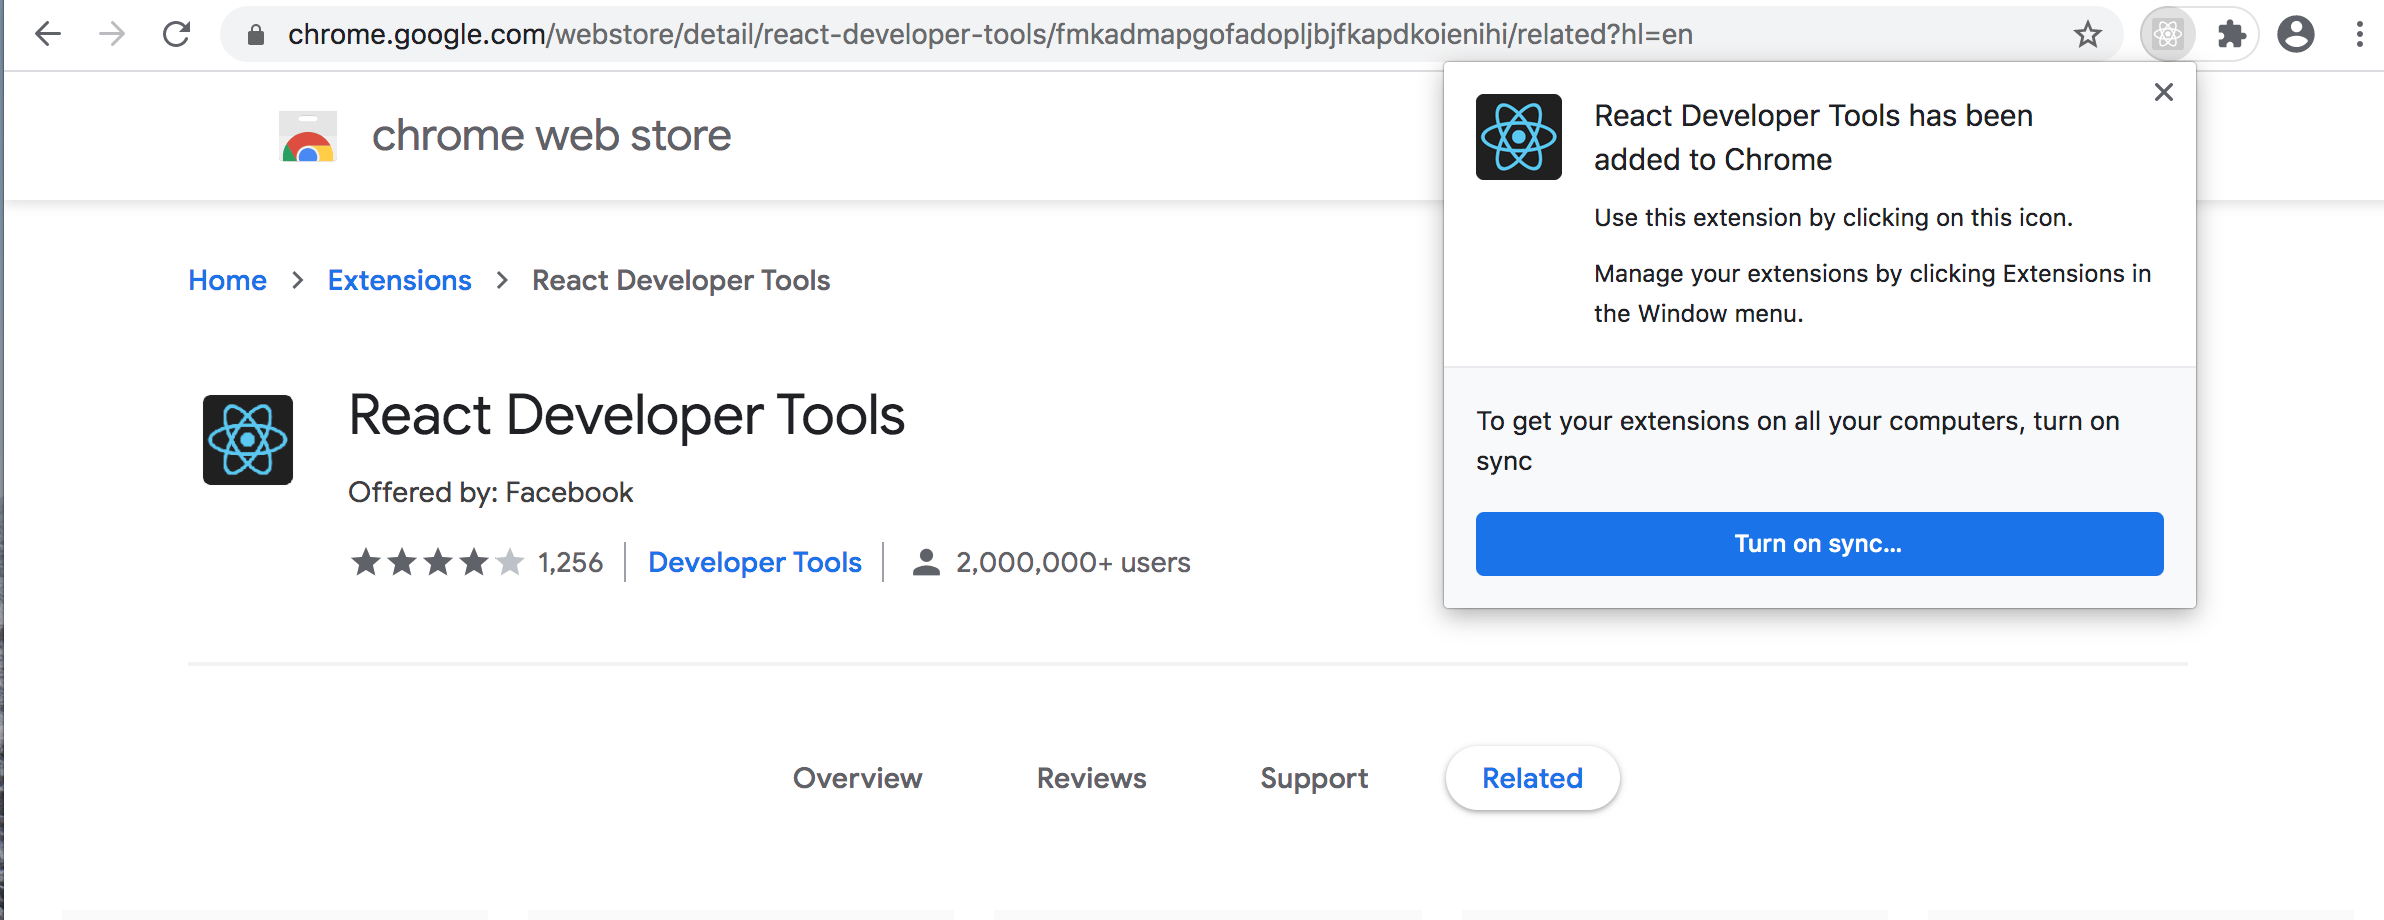
Chrome will install the extension, and a success message and a new icon will appear in the upper right corner of your browser next to the address bar:
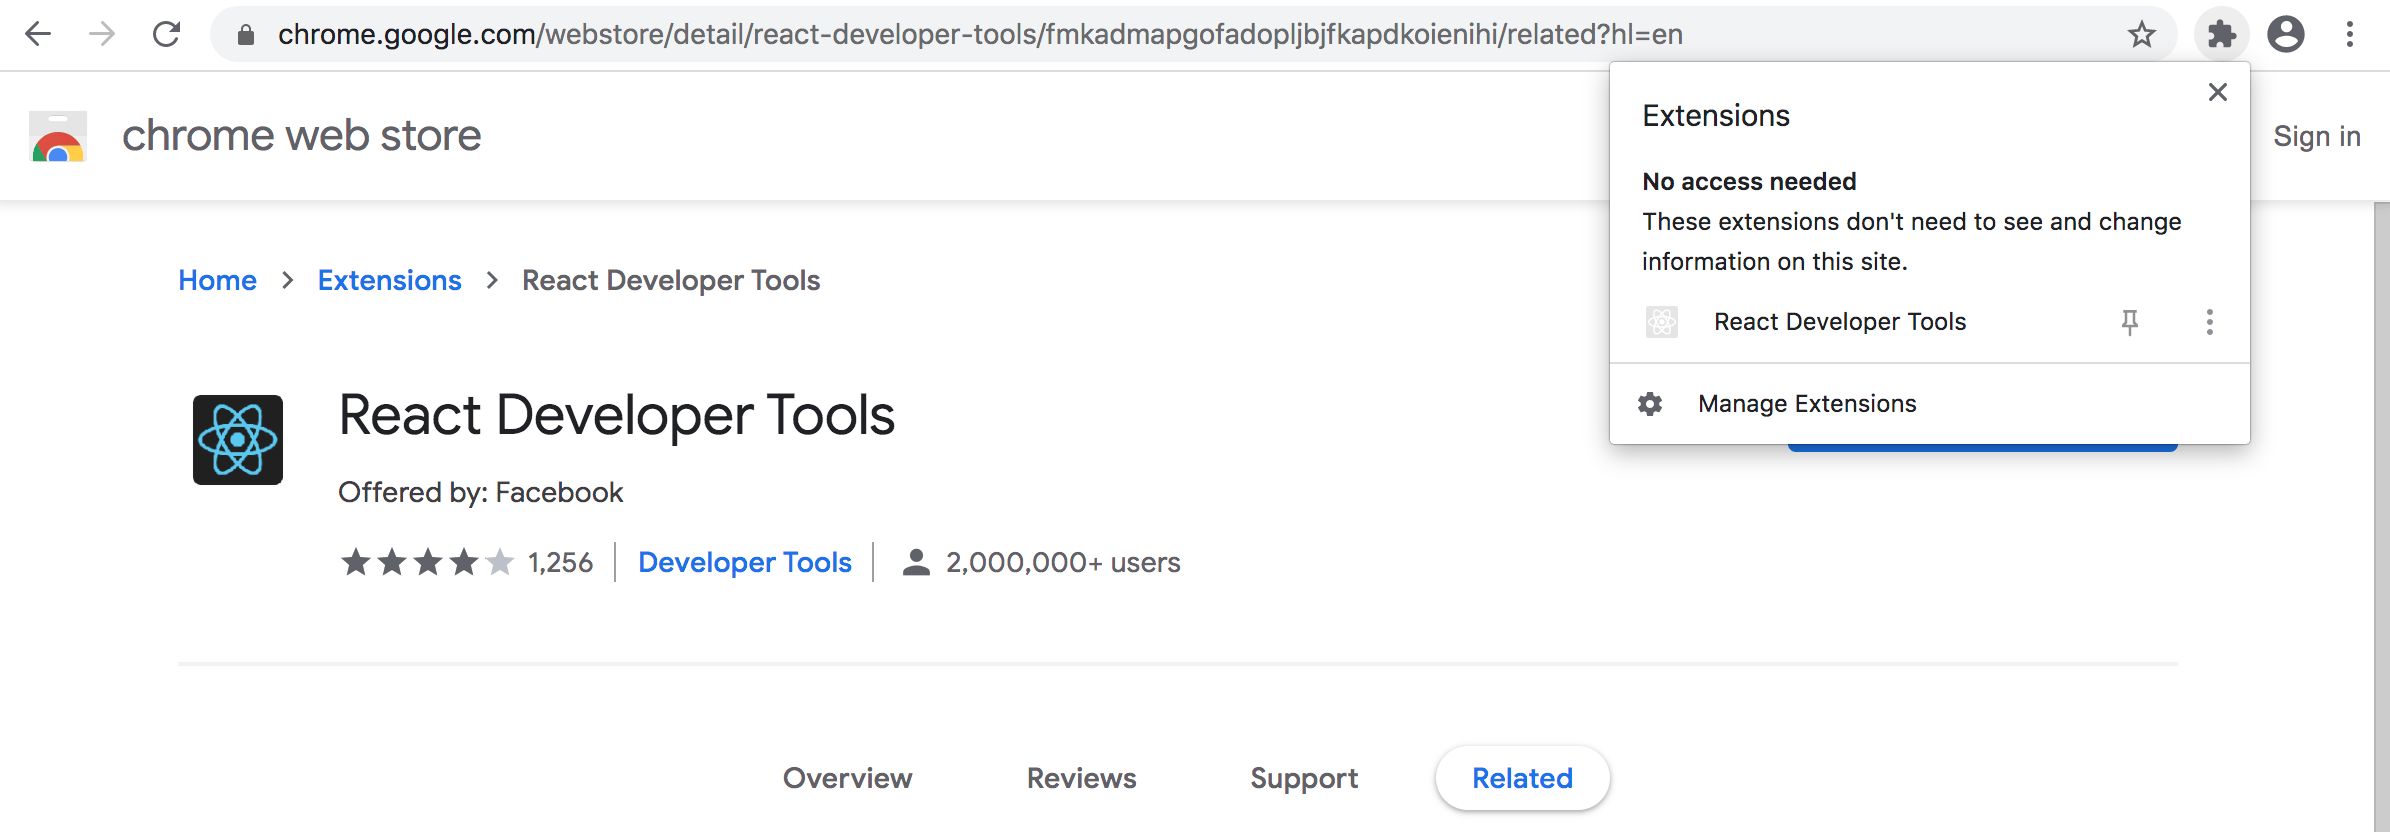
If the icon does not appear, you can add it by clicking on the puzzle piece, then clicking on the pushpin icon by the React Developer Tools:
When you are on a page that does not have any React components, the icon will appear gray. However, if you are on a page with React components, the icon will appear blue and green. If you click on the icon, it will indicate that the application is running a production version of React.
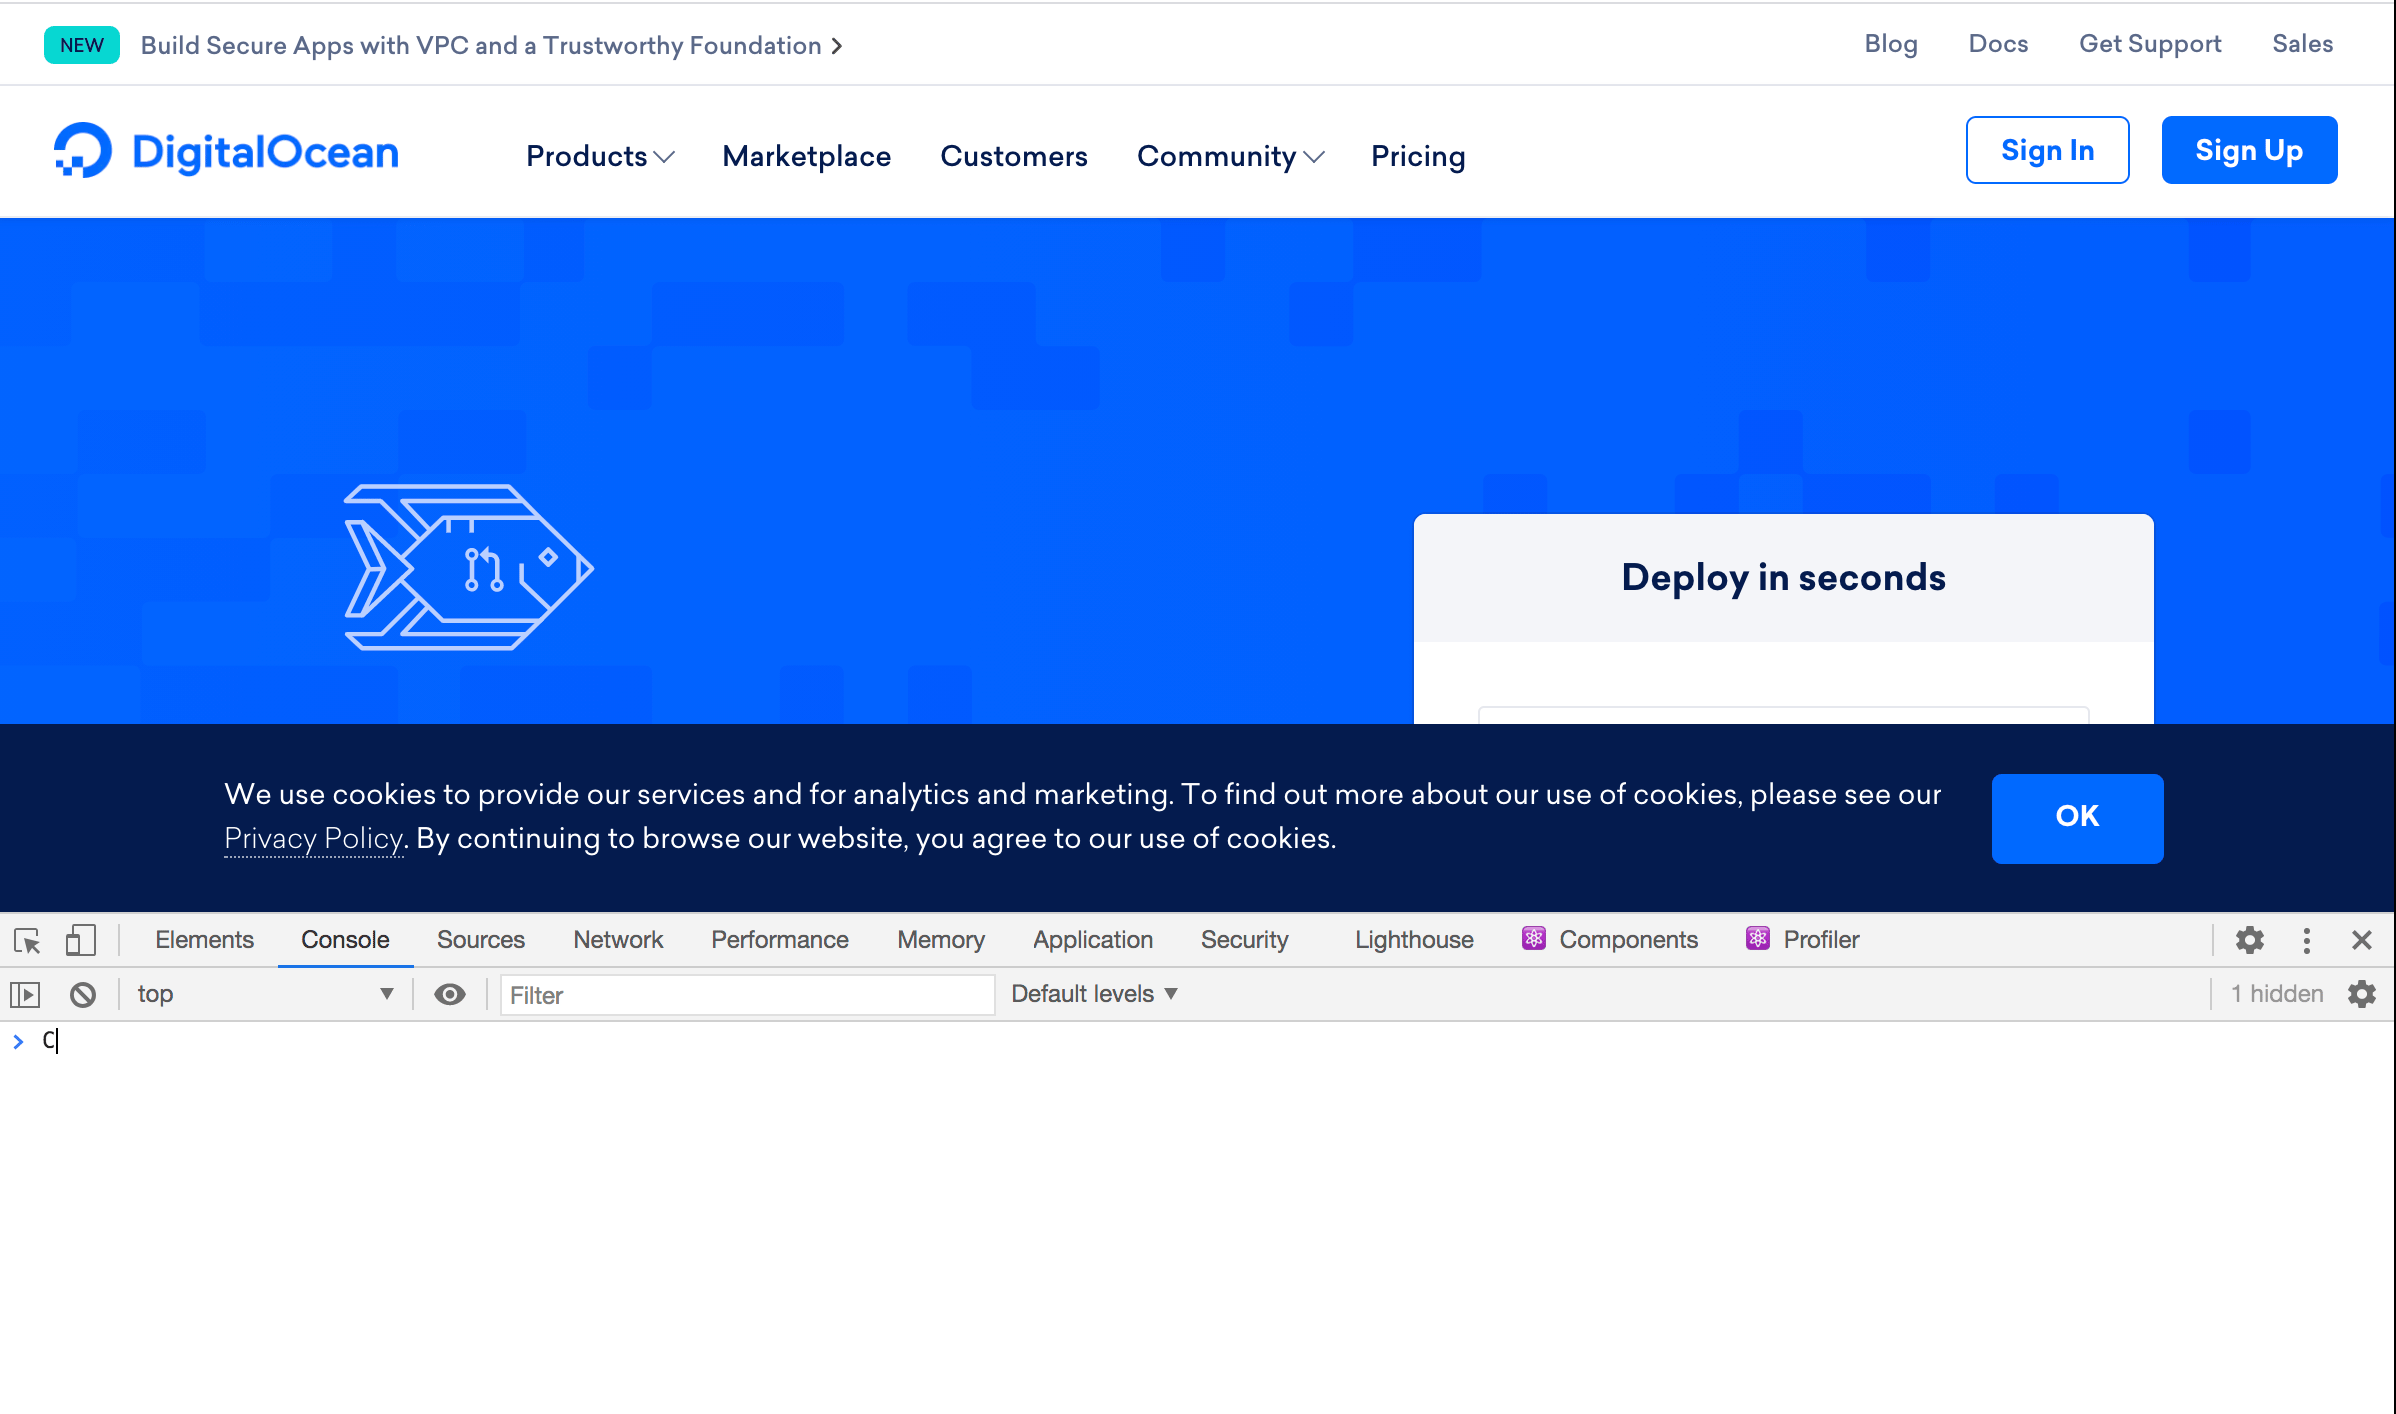
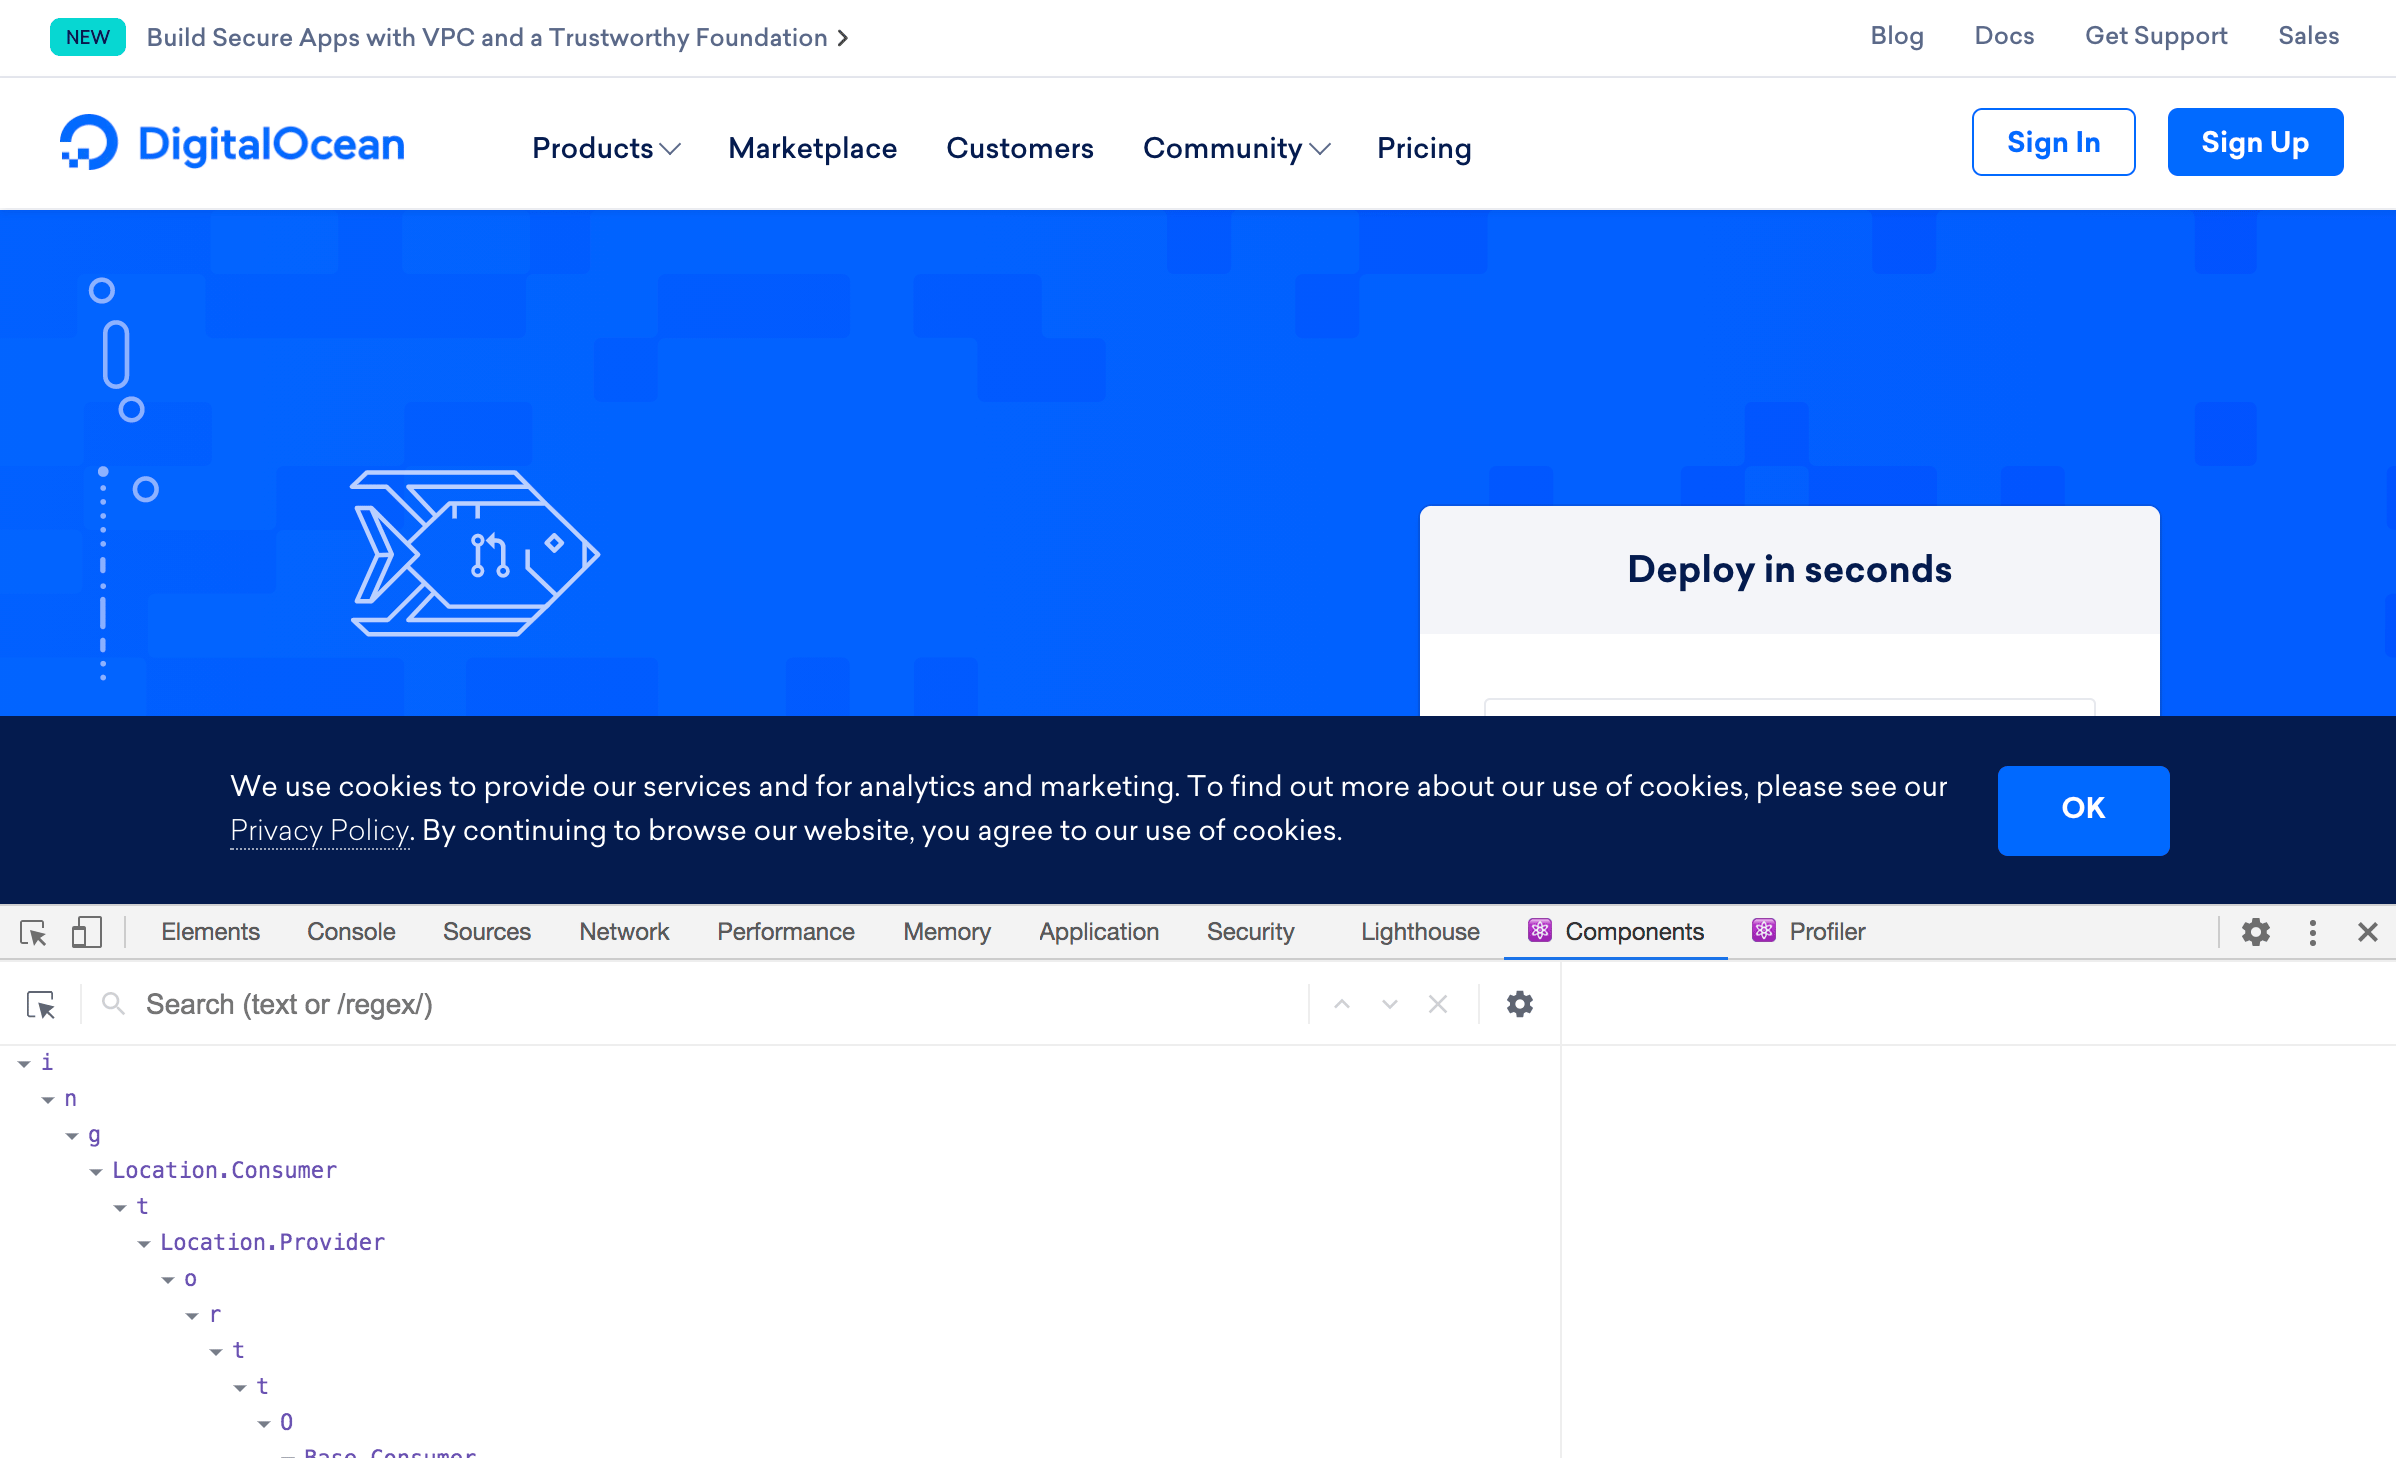
Visit digitalocean.com, to find that the homepage is running a production version of React:

Now that you are on a website that uses React, open the console to access the React Developer Tools. Open the console by either right-clicking and inspecting an element or by opening the toolbar by clicking View > Developer > JavaScript console.
When you open the console, you’ll find two new tabs: Components and Profiler:
The Components tab will show the current React component tree, along with any props, state, or context. The Profiler tab lets you record interactions and measure component rendering. You’ll explore the Profiler tab in Step 3.
Click on the Components tab to see the current component tree.
Since this is a production build, the code will be minified and the components will not have descriptive names:
Now that you’ve tried out React Developer Tools on a working website, you can use it on your test application. If you haven’t started your debug-tutorial application yet, go to a terminal window and run npm start from the root of the project.
Open a browser to http://localhost:3000.
Notice that the icon for React Developer Tools is now red and white. If you click on the React Developer Tools icon, you’ll see a warning that the page is in development mode. Since you are still working on the sample application, this is expected.
Open the console and you’ll find the name of the App component in the Components tab.
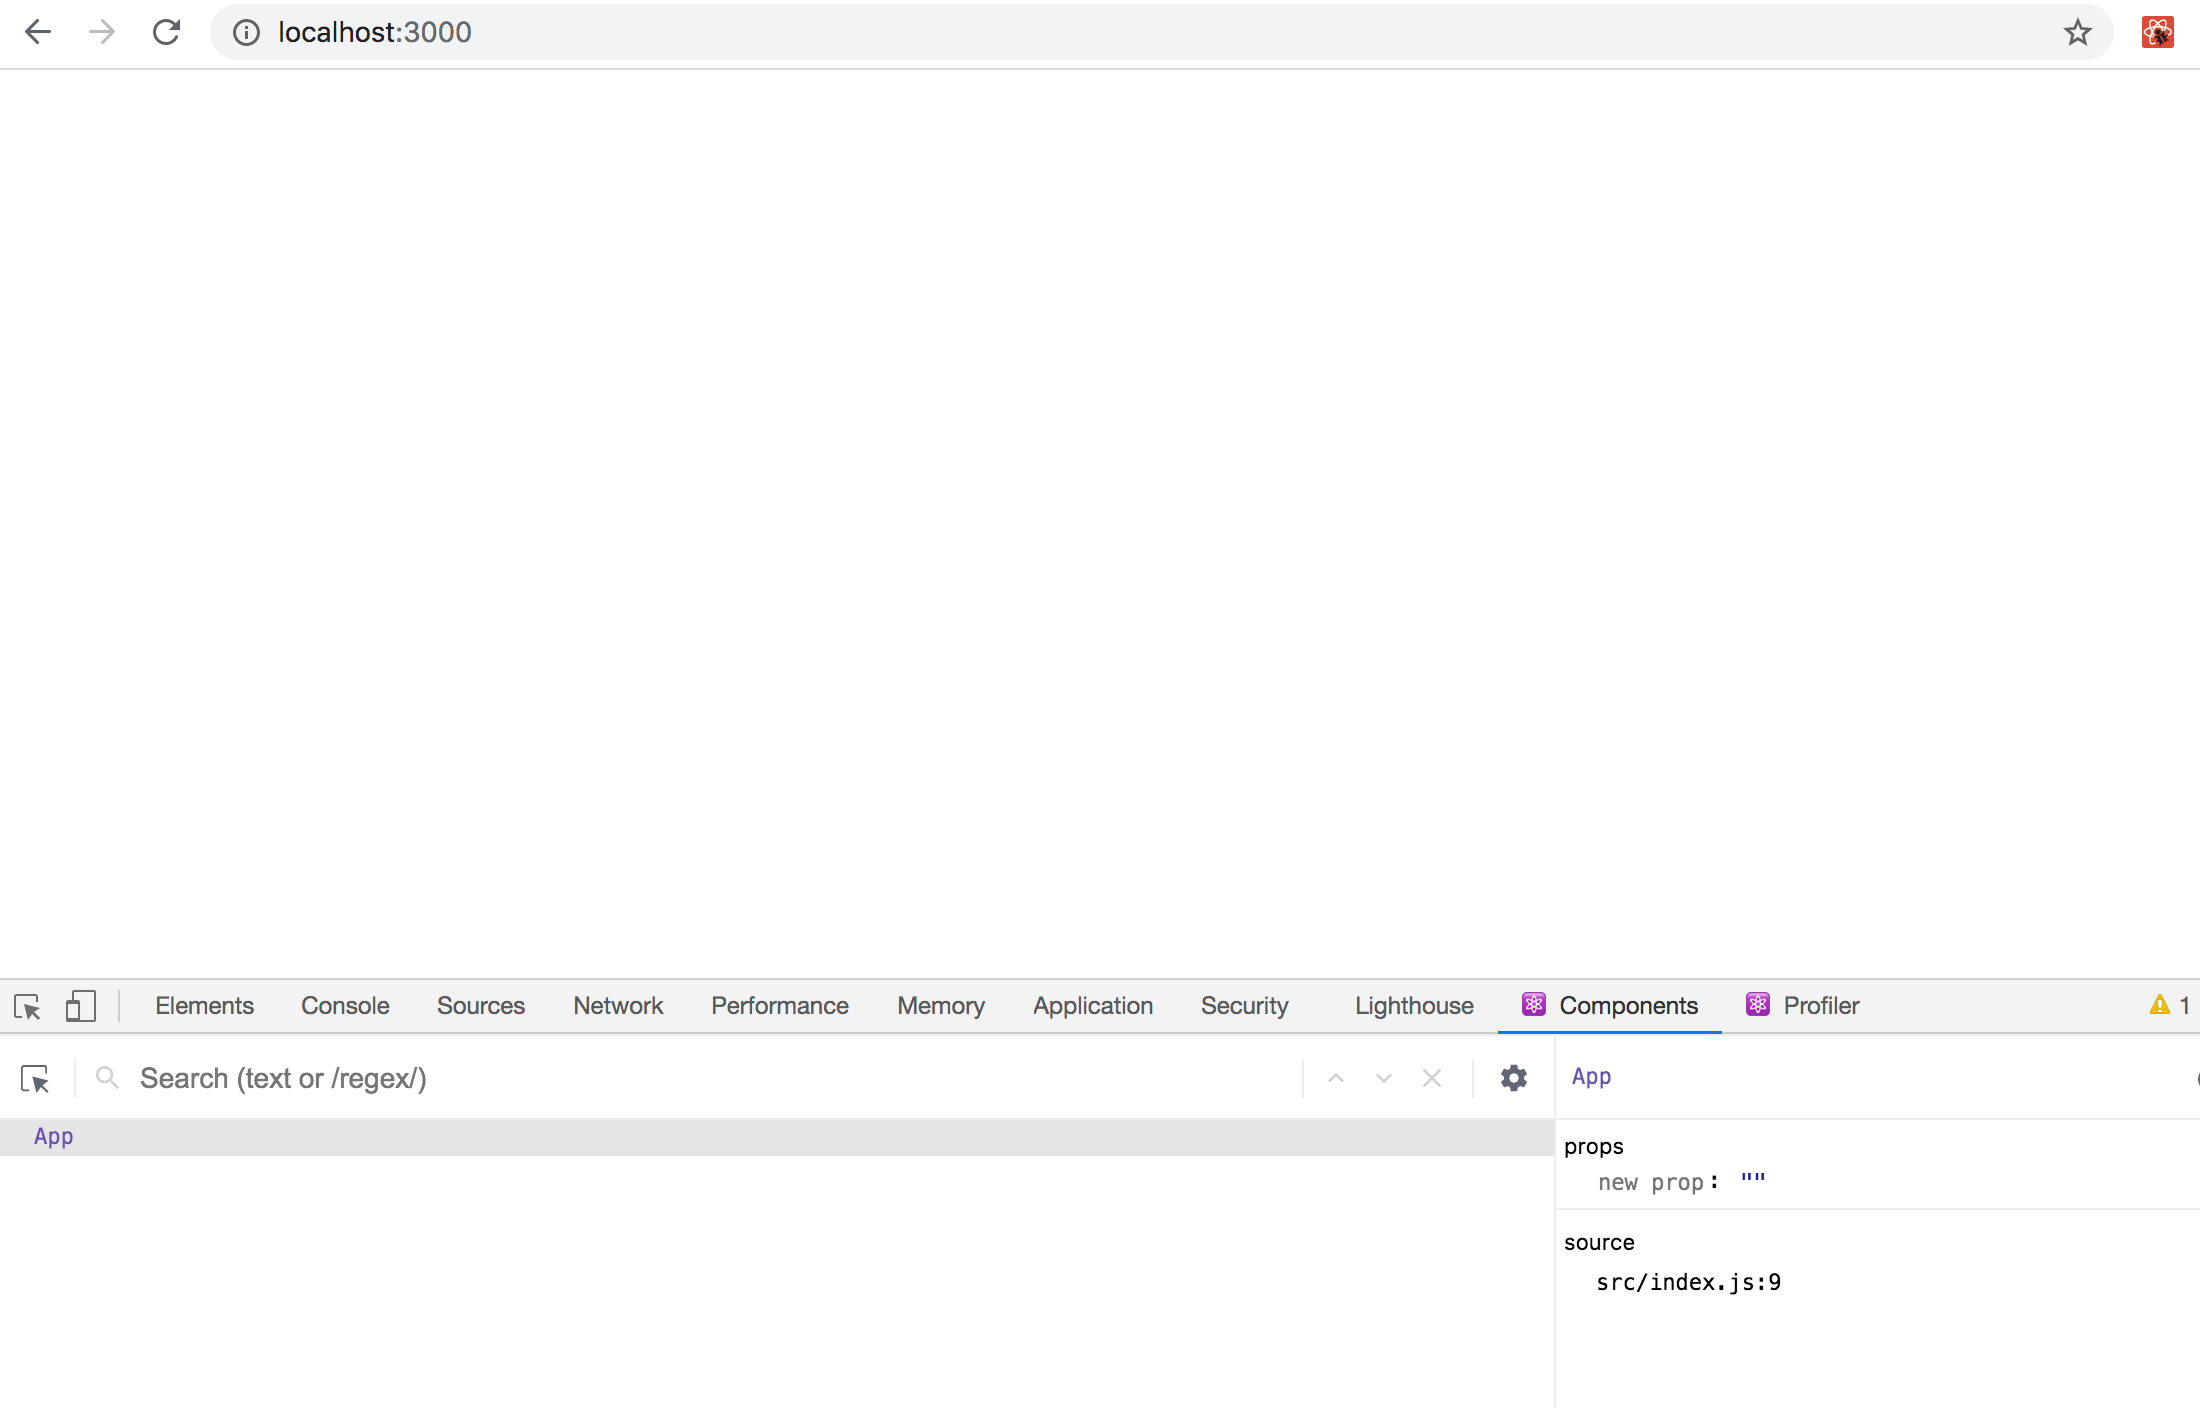
There’s not a lot of information yet, but as you build out the project in the next step, you’ll see all of your components forming a navigable tree.
In this step, you added the React Developer Tools extension to Chrome. You activated the tools on both a production and a development page, and you briefly explored your debug-tutorial project in the Components tab. In the next step, you’ll build the text analyzer that you’ll use to try out the features of the React Developer Tools.
Step 2 — Identifying Real-Time Component Props and Context
In this step, you’ll build a small application to analyze a block of text. The app will determine and report the word count, character count, and character frequency of the text in the input field. As you build the application, you’ll use React Developer Tools to explore the current state and props of each component. You’ll also use React Developer Tools to view the current context in deeply nested components. Finally, you’ll use the tools to identify components that re-render as state changes.
By the end of this step, you’ll be able to use the React Developer Tools to explore a live application and to observe the current props and state without console statements or debuggers.
To start, you will create an input component that will take a large amount of text.
Open the App.js file:
- nano src/components/App/App.js
Inside the component, add a div with a class of wrapper, then create a <label> element surrounding a <textarea> element:
import React from 'react';
import './App.css';

function App() {
  return(
    <div className="wrapper">
     <label htmlFor="text">
       Add Your Text Here:
       <br>
       <textarea
         id="text"
         name="text"
         rows="10"
         cols="100"
       >
       </textarea>
      </label>
    </div>
  )
}

export default App;
This will be the input area for your user. The htmlFor attribute links the label element to elements with an id of text using JSX. You also give the <textarea> component 10 rows and 100 columns to provide room for a large amount of text.
Save and close the file. Next, open App.css:
- nano src/components/App/App.css
Add some styling to the application by replacing the contents with the following:
.wrapper {
    padding: 20px;
}

.wrapper button {
    background: none;
    border: black solid 1px;
    cursor: pointer;
    margin-right: 10px;
}

.wrapper div {
    margin: 20px 0;
}
Here you add some padding to the wrapper class, then simplify child <button> elements by removing the background color and adding some margin. Finally, you add a small margin to child <div> elements. These styles will apply to components you will build to display information about the text.
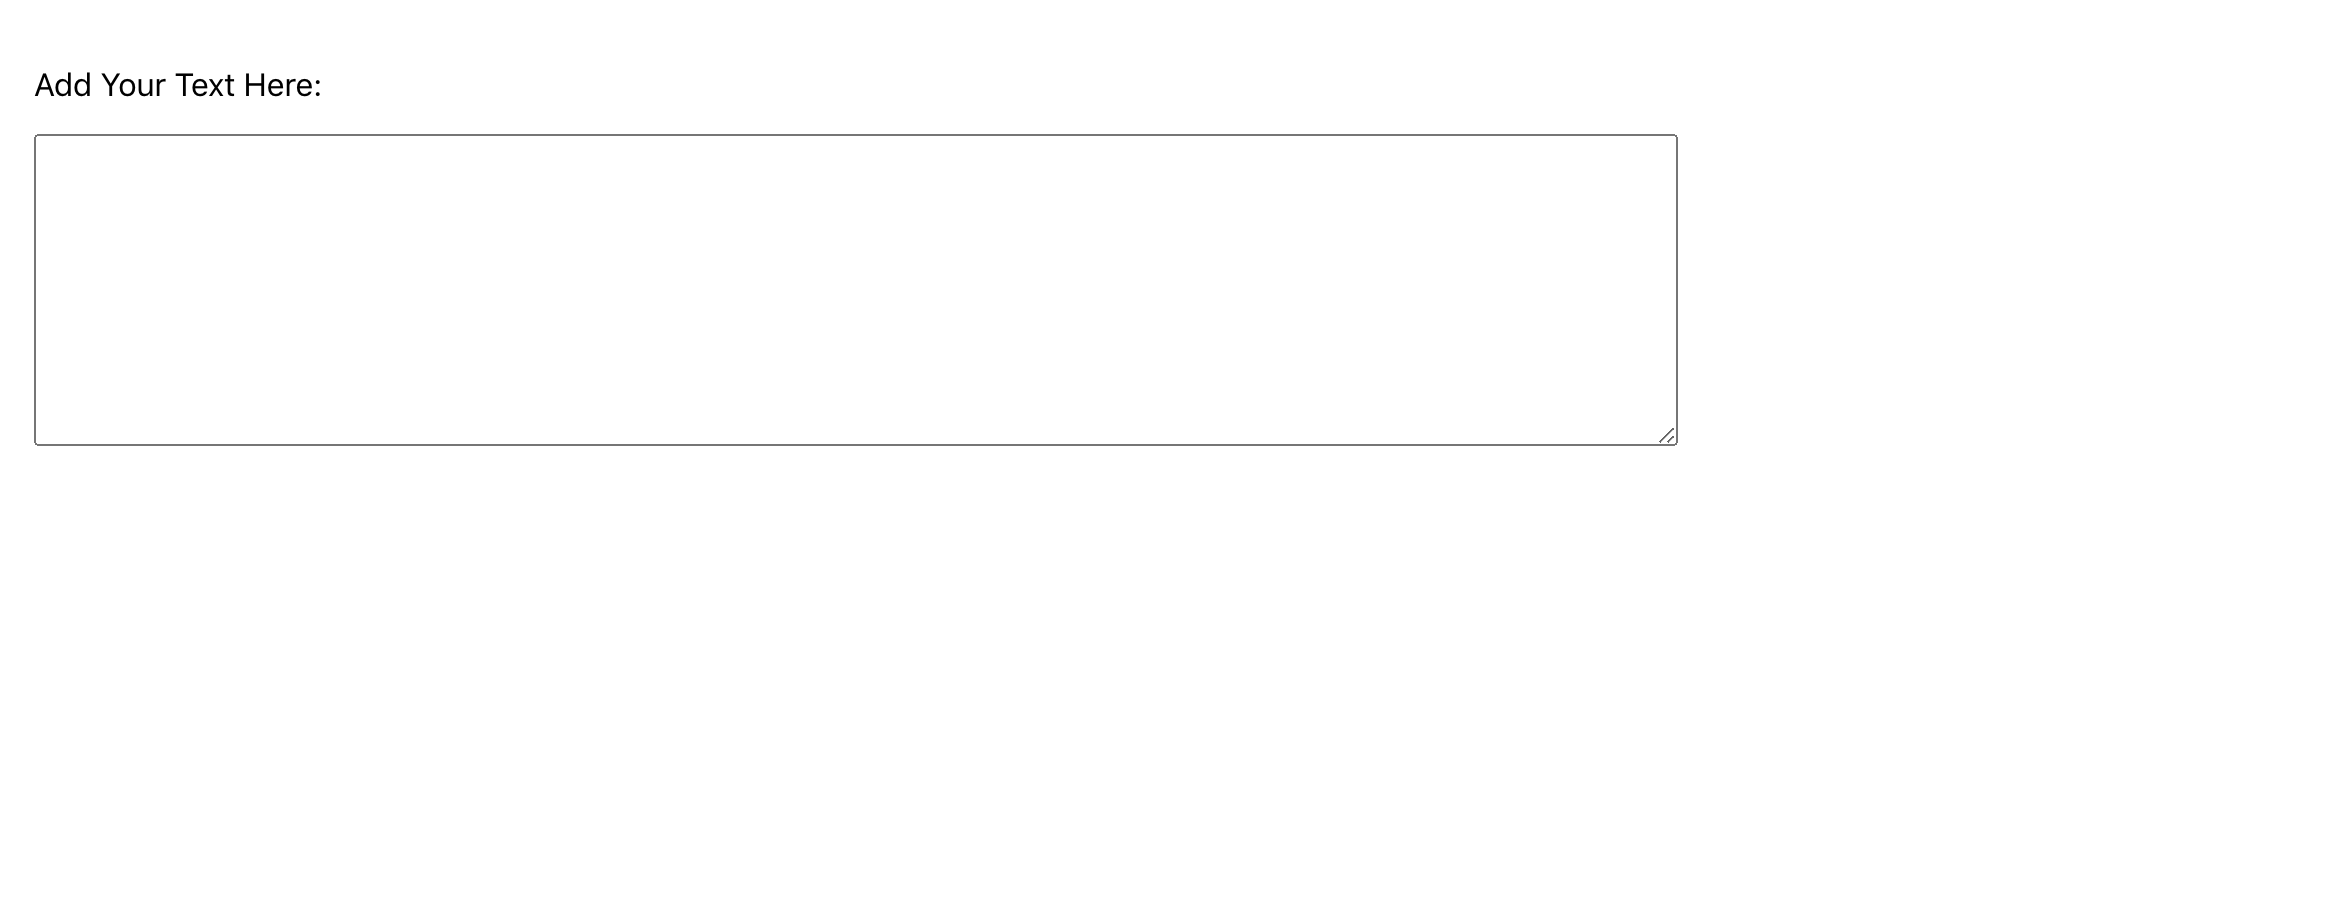
Save the file. When you do, the browser will refresh and you’ll see the input:
Open App.js:
- nano src/components/App/App.js
Next, create a context to hold the value from the <textarea> element. Capture the data using the useState Hook:
import React, { createContext, useState } from 'react';
import './App.css';

export const TextContext = createContext();

function App() {
  const [text, setText] = useState('');

  return(
    <TextContext.Provider value={text}>
      <div className="wrapper">
        <label htmlFor="text">
          Add Your Text Here:
          <br>
          <textarea
            id="text"
            name="text"
            rows="10"
            cols="100"
            onChange={e => setText(e.target.value)}
          >
          </textarea>
        </label>
      </div>
    </TextContext.Provider>
  )
}

export default App;
Be sure to export TextContext, then wrap the whole component with the TextContext.Provider. Capture the data by adding an onChange prop to your <textarea> element.
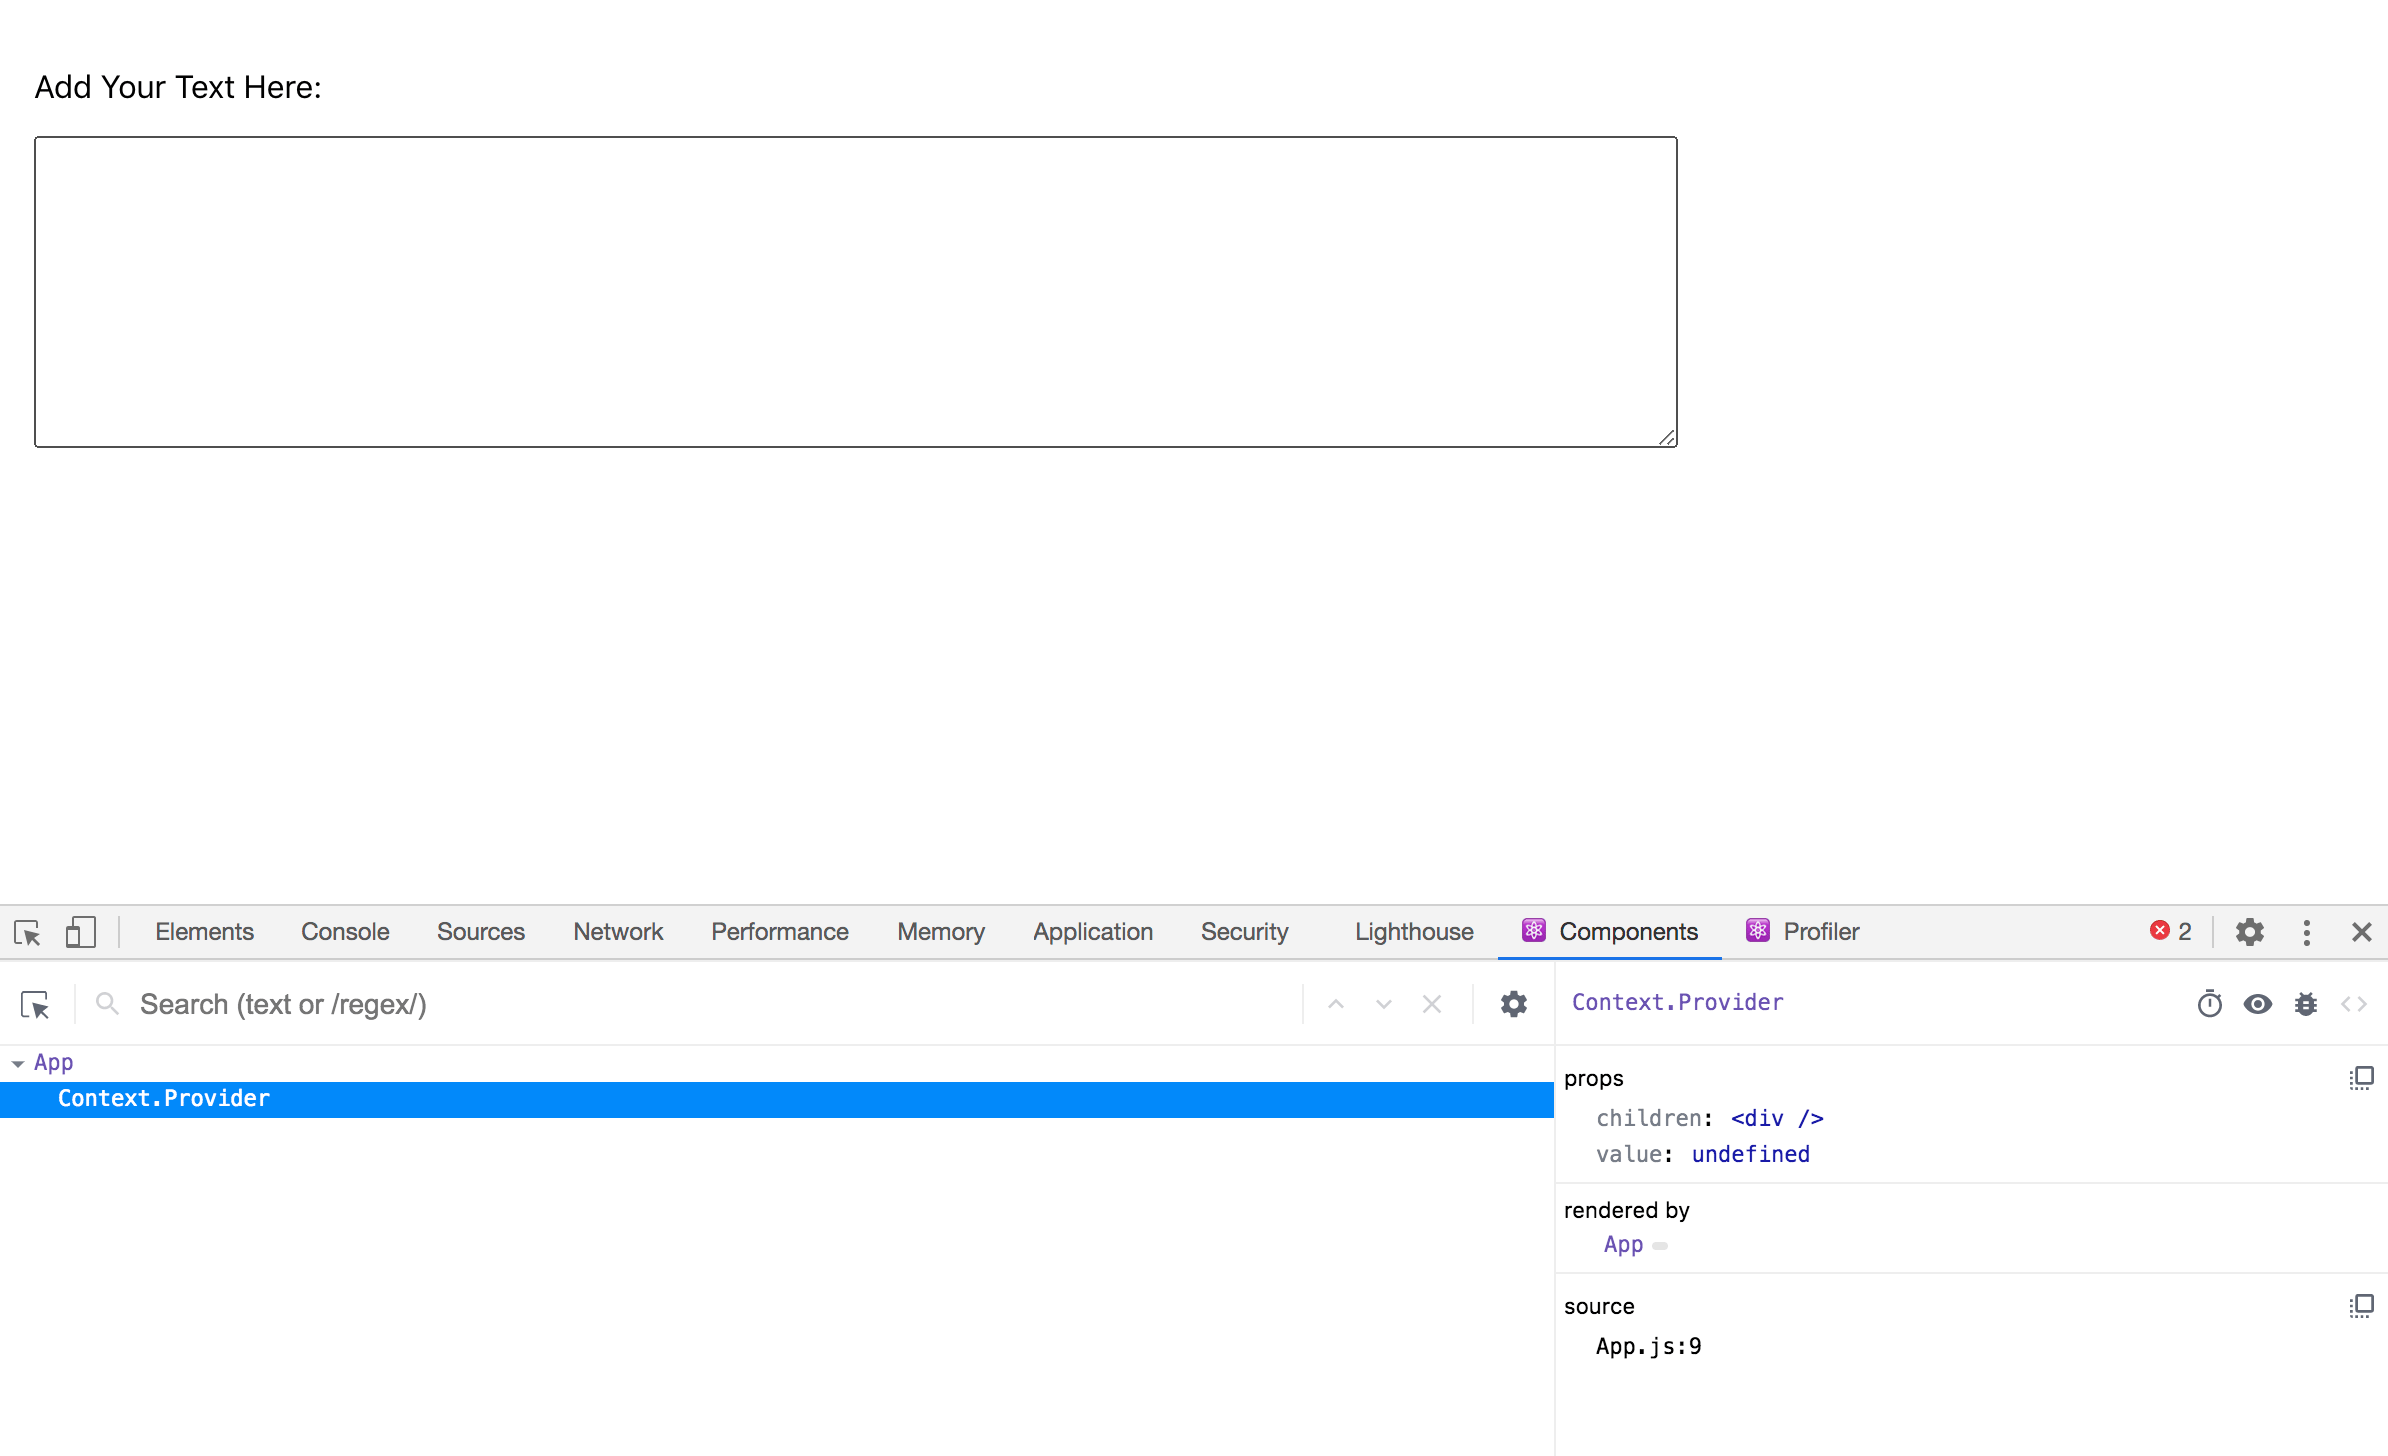
Save the file. The browser will reload. Be sure that you have React Developer Tools open and notice that App component now shows theContext.Provider as a child component.
The component by default has a generic name—Context—but you can change that by adding a displayName property to the generated context. Inside App.js, add a line where you set the displayName to TextContext:
import React, { createContext, useState } from 'react';
import './App.css';

export const TextContext = createContext();
TextContext.displayName = 'TextContext';

function App() {
    ...
}

export default App;
It is not necessary to add a displayName, but it does help to navigate components when analyzing the component tree in the console. You will also see the value of the useState Hook in the side bar. Type some text in the input and you’ll see the updated value in React Developer Tools under the hooks section on the App component.
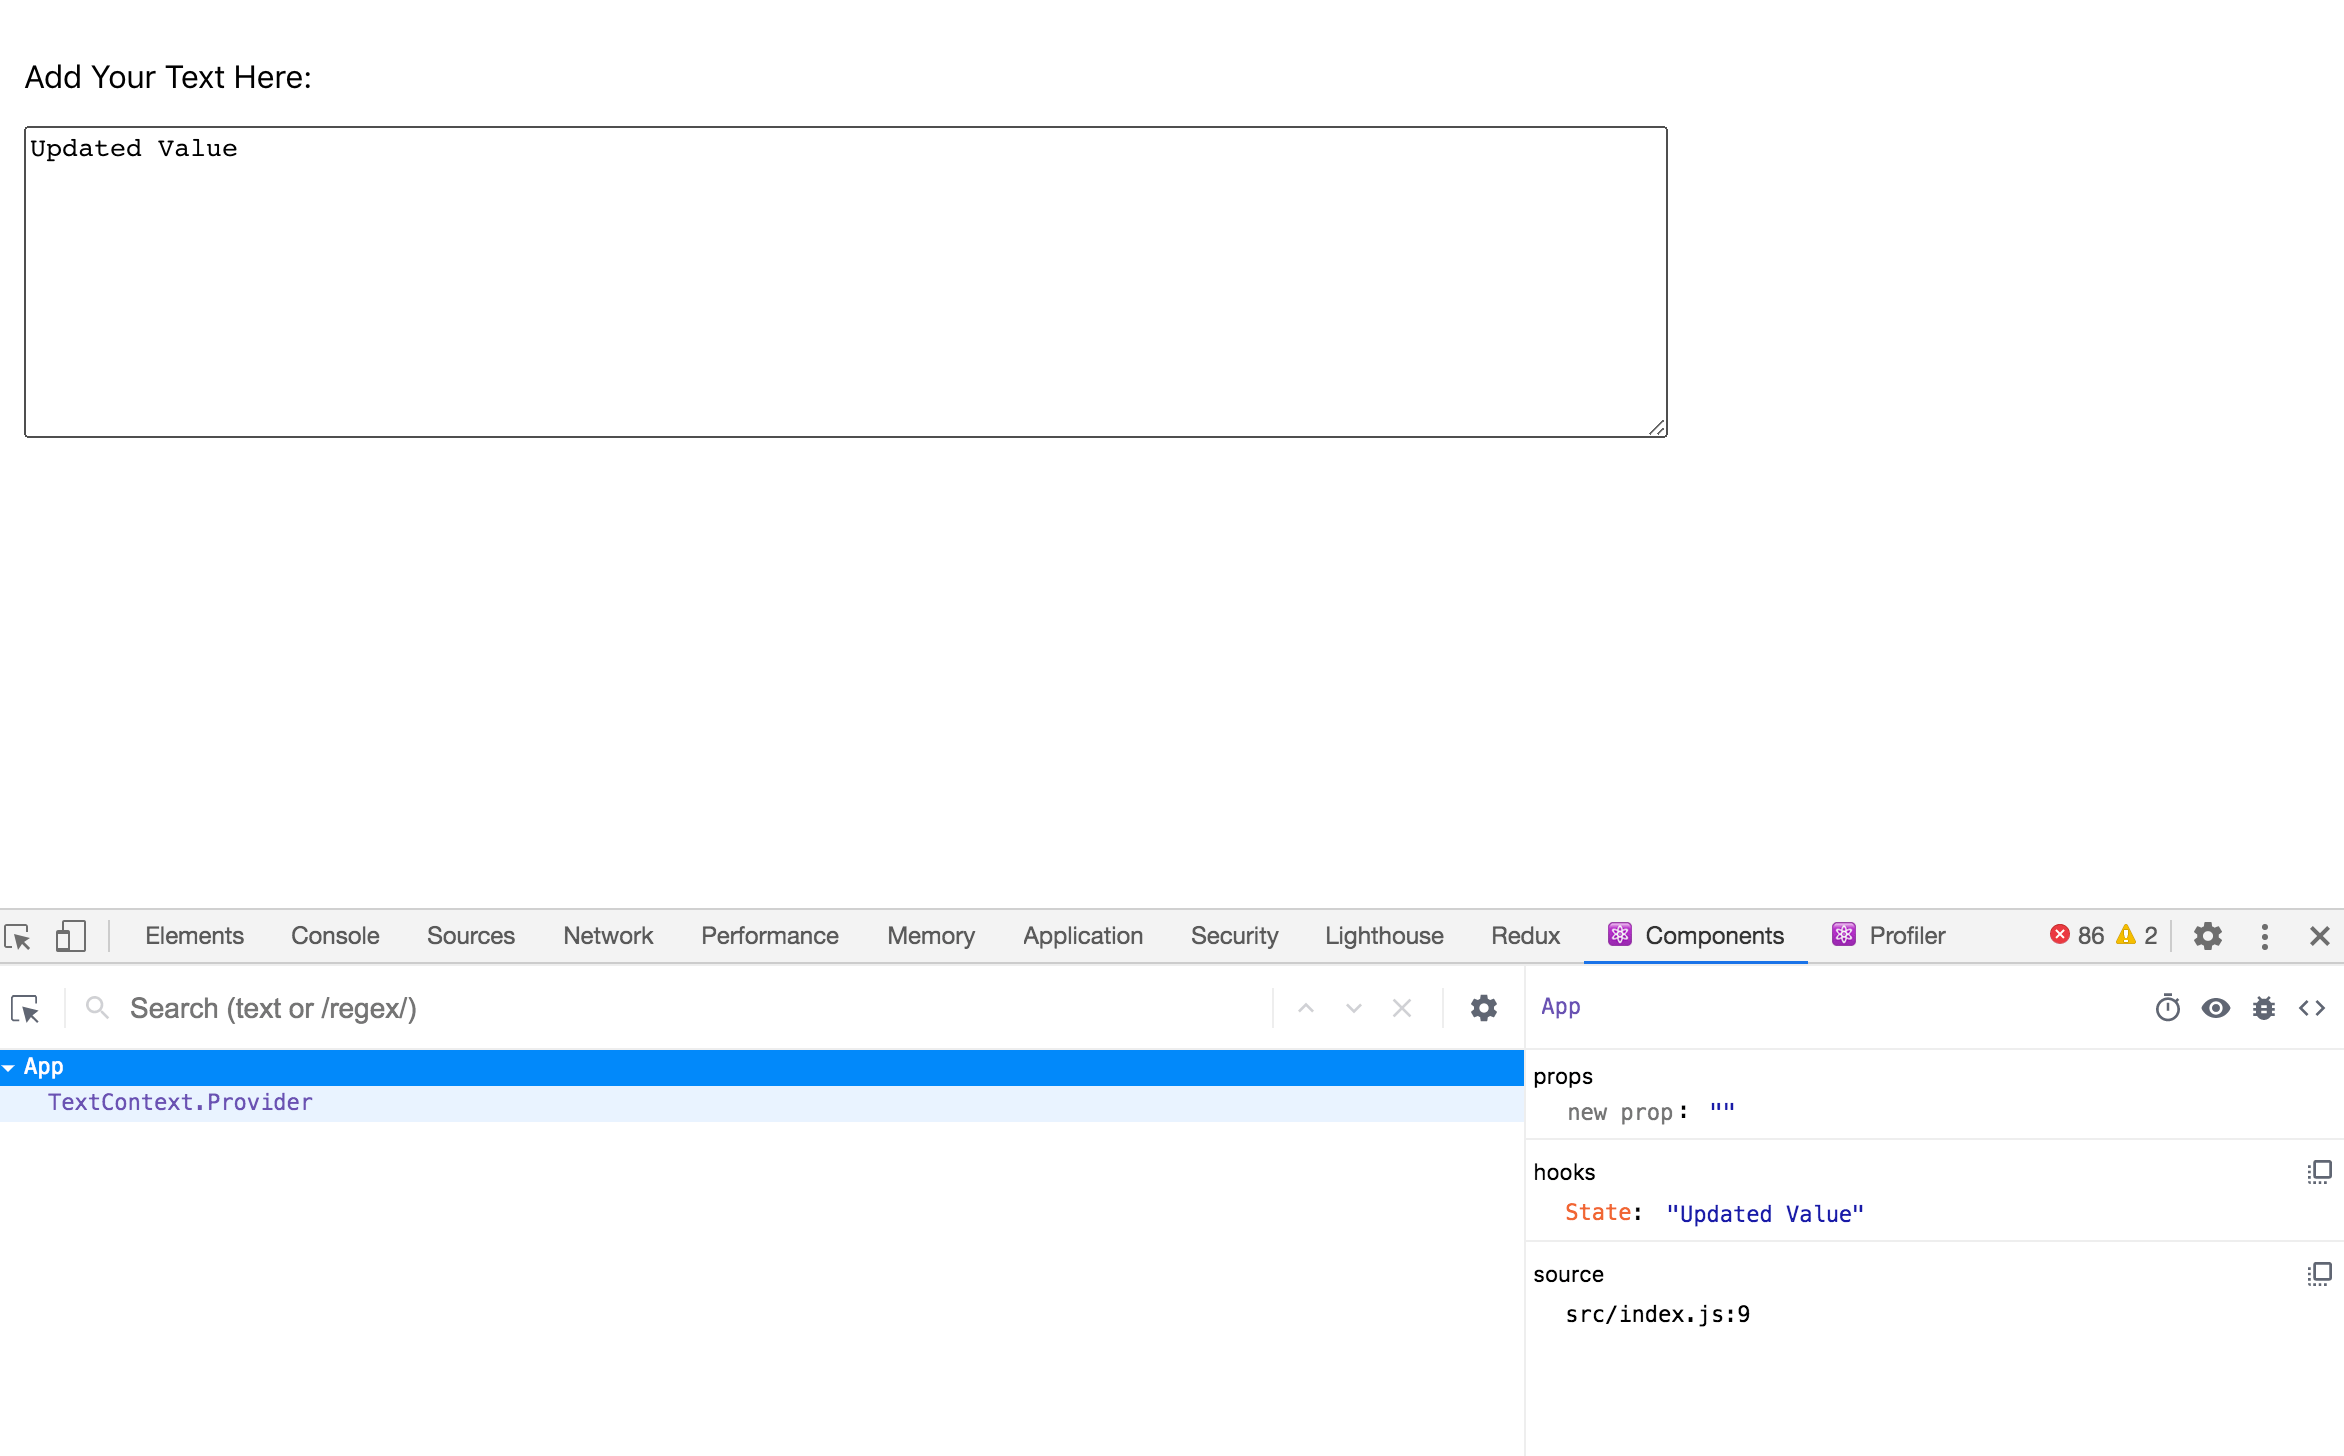
The Hook also has a generic name of State, but this is not as easy to update as the context. There is a useDebugValue Hook, but it only works on custom Hooks and is not recommended for all custom Hooks.
In this case, the state for the App component is the prop to TextContext.Provider. Click on the TextContext.Provider in the React Developer Tools and you’ll see that the value also reflects the input value that you set with the state:
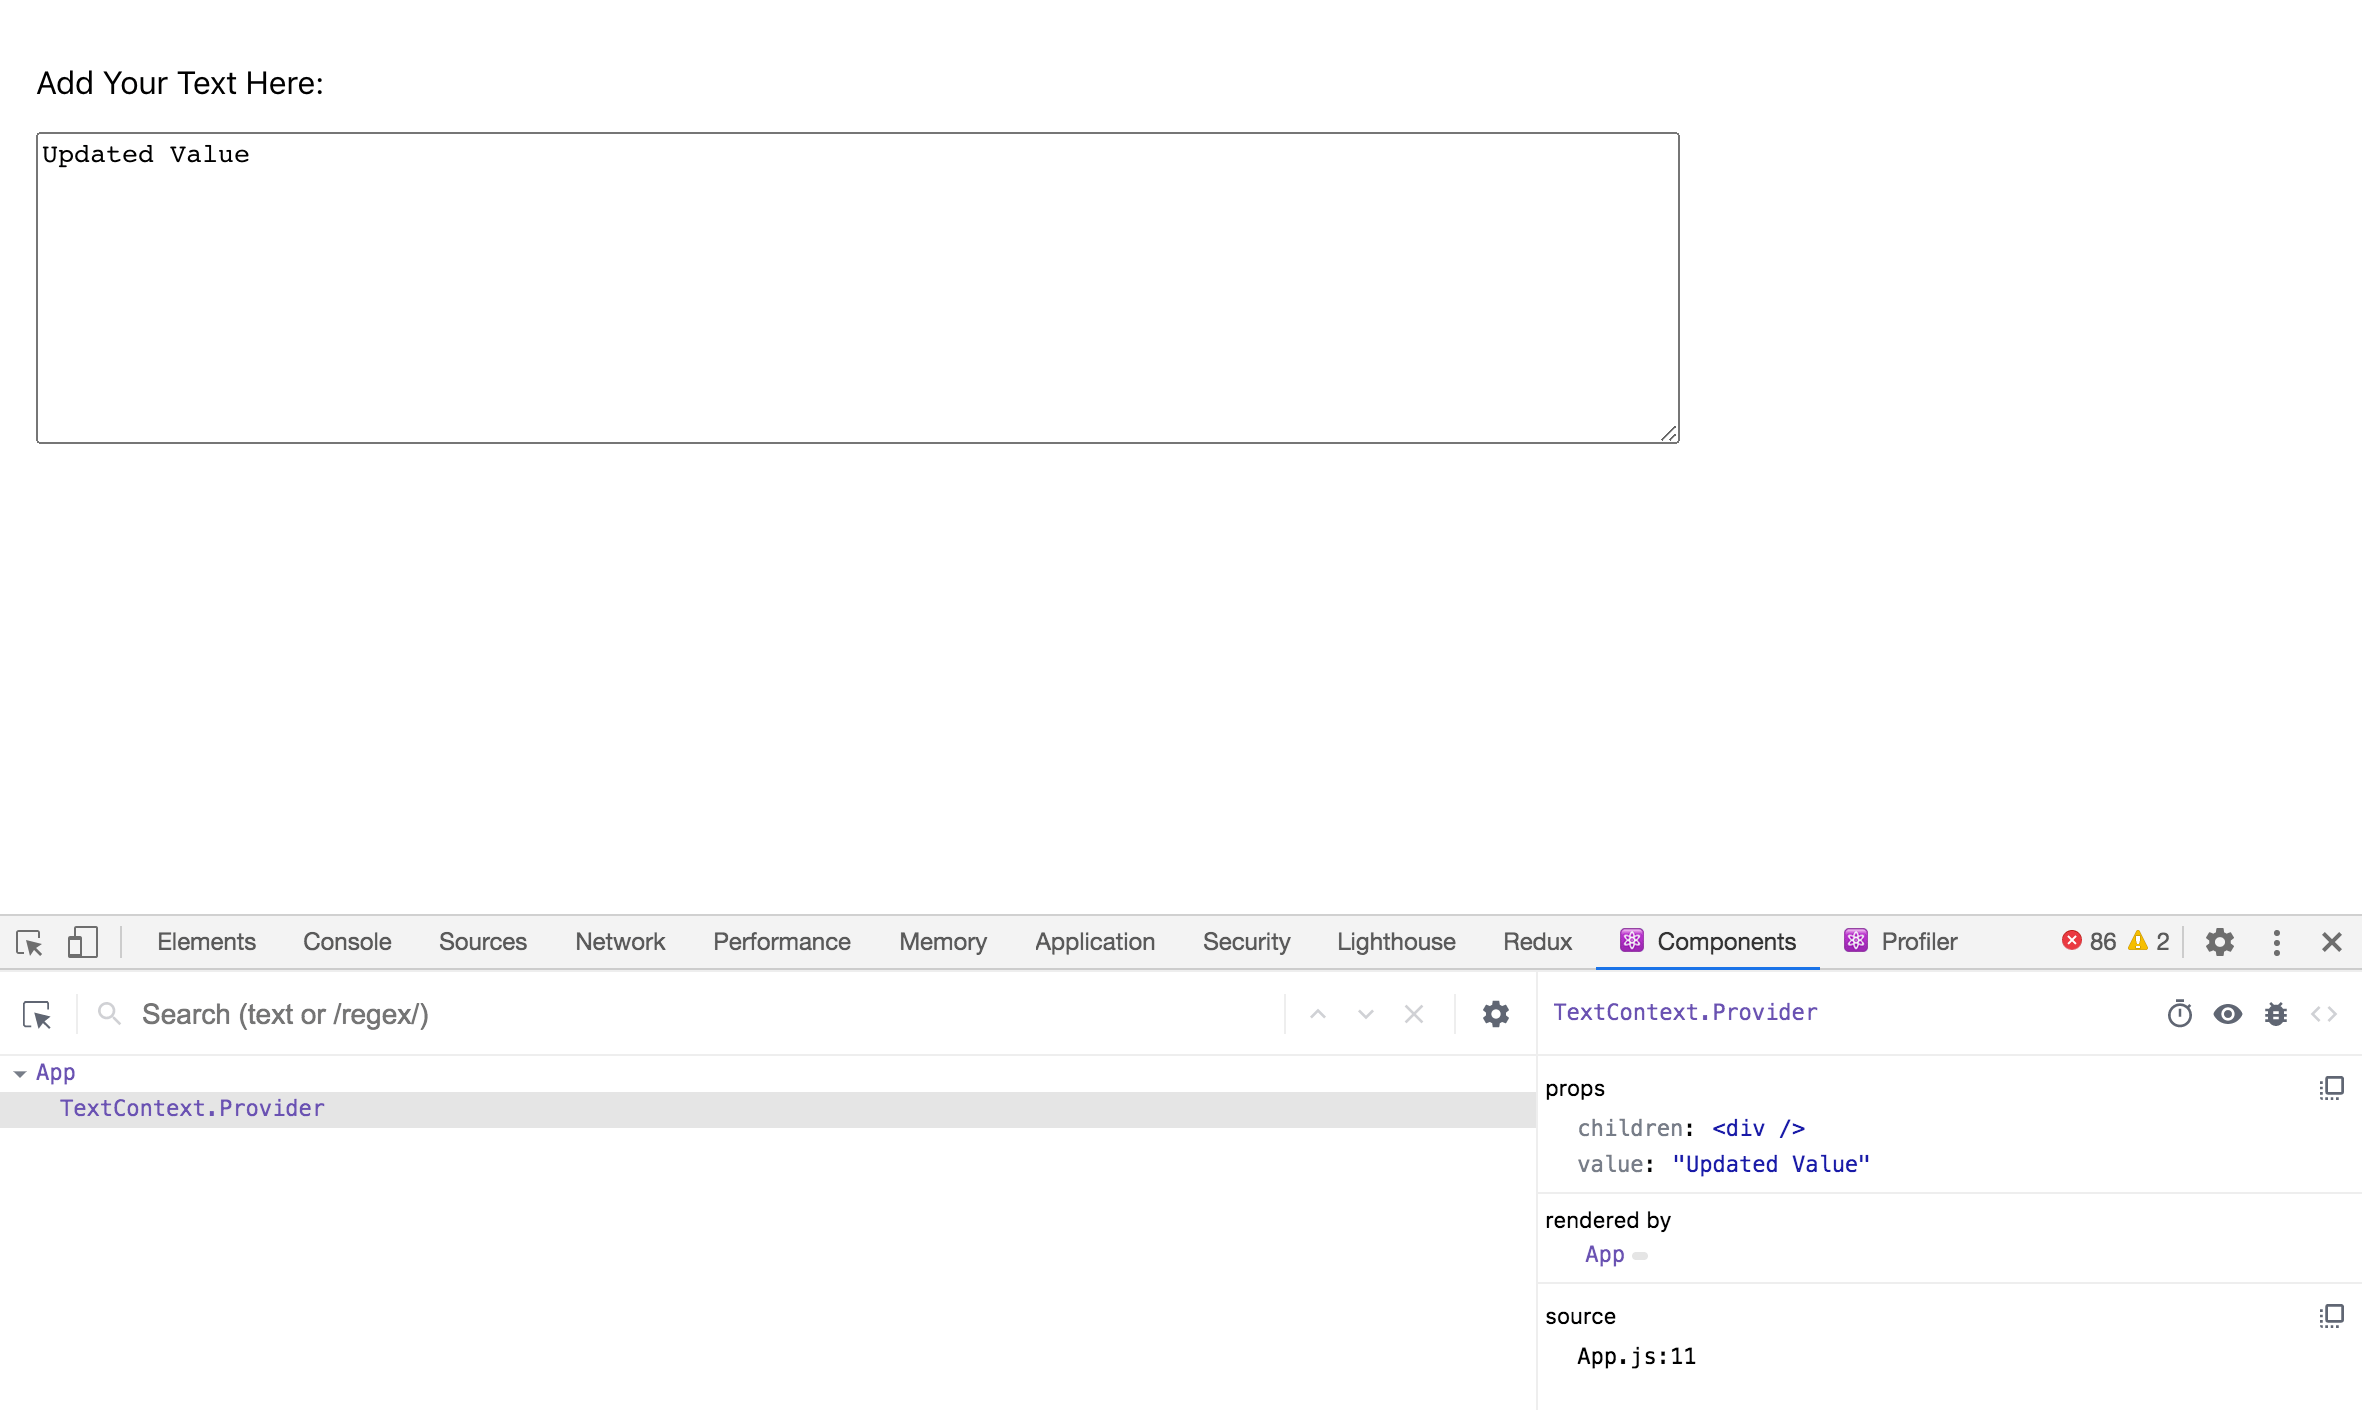
React Developer Tools is showing you real time prop and context information, and the value will grow as you add components.
Next, add a component called TextInformation. This component will be a container for the components with specific data analysis, such as the word count.
First, make the directory:
- mkdir src/components/TextInformation
Then open TextInformation.js in your text editor.
- nano src/components/TextInformation/TextInformation.js
Inside the component, you will have three separate components: CharacterCount, WordCount, and CharacterMap. You’ll make these components in just a moment.
The TextInformation component will use the useReducer Hook to toggle the display of each component. Create a reducer function that toggles the display value of each component and a button to toggle each component with an onClick action:
import React, { useReducer } from 'react';

const reducer = (state, action) => {
  return {
    ...state,
    [action]: !state[action]
  }
}
export default function TextInformation() {
  const [tabs, toggleTabs] = useReducer(reducer, {
    characterCount: true,
    wordCount: true,
    characterMap: true
  });

  return(
    <div>
      <button onClick={() => toggleTabs('characterCount')}>Character Count</button>
      <button onClick={() => toggleTabs('wordCount')}>Word Count</button>
      <button onClick={() => toggleTabs('characterMap')}>Character Map</button>
    </div>
  )
}
Notice that your useReducer Hook starts with an object that maps each key to a boolean. The reducer function uses the spread operator to preserve the previous value while setting a new value using the action parameter.
Save and close the file. Then open App.js:
- nano src/components/App/App.js
Add in your new component:
import React, { createContext, useState } from 'react';
import './App.css';
import TextInformation from '../TextInformation/TextInformation';

...

function App() {
  const [text, setText] = useState('');

  return(
    <TextContext.Provider value={text}>
      <div className="wrapper">
        <label htmlFor="text">
          Add Your Text Here:
          <br>
          <textarea
            id="text"
            name="text"
            rows="10"
            cols="100"
            onChange={e => setText(e.target.value)}
          >
          </textarea>
        </label>
        <TextInformation />
      </div>
    </TextContext.Provider>
  )
}

export default App;
Save and close the file. When you do, the browser will reload, and you’ll see the updated component. If you click on TextInformation in React Developer Tools, you’ll see the value update on each button click:
Now that you have the container component, you’ll need to create each informational component. Each component will take a prop called show. If show is falsy, the component will return null. The components will consume the TextContext, analyze the data, and display the result.
To start, create the CharacterCount component.
First, make a new directory:
- mkdir src/components/CharacterCount
Then, open CharacterCount.js in your text editor:
- nano src/components/CharacterCount/CharacterCount.js
Inside the component, create a function that uses the show prop and displays null if show is falsy:
import React, { useContext } from 'react';
import PropTypes from 'prop-types';
import { TextContext } from '../App/App';

export default function CharacterCount({ show }) {
  const text = useContext(TextContext);

  if(!show) {
    return null;
  }

  return(
    <div>
      Character Count: {text.length}
    </div>
  )
}

CharacterCount.proTypes = {
  show: PropTypes.bool.isRequired
}
Inside the CharacterCount function, you assign the value of TextContext to a variable using the useContext Hook. You then return a <div> that shows the character count using the length method. Finally, PropTypes adds a weak typing system to provide some enforcement to make sure the wrong prop type is not passed.
Save and close the file. Open TextInformation.js:
- nano src/components/TextInformation/TextInformation.js
Import CharacterCount and add the component after the buttons, passing tabs.characterCount as the show prop:
import React, { useReducer } from 'react';
import CharacterCount from '../CharacterCount/CharacterCount';

const reducer = (state, action) => {
  return {
    ...state,
    [action]: !state[action]
  }
}

export default function TextInformation() {
  const [tabs, toggleTabs] = useReducer(reducer, {
    characterCount: true,
    wordCount: true,
    characterMap: true
  });

  return(
    <div>
      <button onClick={() => toggleTabs('characterCount')}>Character Count</button>
      <button onClick={() => toggleTabs('wordCount')}>Word Count</button>
      <button onClick={() => toggleTabs('characterMap')}>Character Map</button>
      <CharacterCount show={tabs.characterCount} />
    </div>
  )
}
Save the file. The browser will reload and you’ll see the component in the React Developer Tools. Notice that as you add words in the input, the context will update. If you toggle the component, you’ll see the props update after each click:

You can also manually add or change a prop by clicking on the property and updating the value:

Next, add a WordCount component.
Create the directory:
- mkdir src/components/WordCount
Open the file in a text editor:
- nano src/components/WordCount/WordCount.js
Make a component that is similar to CharacterCount, but use the split method on spaces to create an array of words before showing the length:
import React, { useContext } from 'react';
import PropTypes from 'prop-types';
import { TextContext } from '../App/App';

export default function WordCount({ show }) {
  const text = useContext(TextContext);

  if(!show) {
    return null;
  }

  return(
    <div>
      Word Count: {text.split(' ').length}
    </div>
  )
}

WordCount.proTypes = {
  show: PropTypes.bool.isRequired
}
Save and close the file.
Finally, create a CharacterMap component. This component will show how often a specific character is used in a block of text. It will then sort the characters by frequency in the passage and display the results.
First, make the directory:
- mkdir src/components/CharacterMap
Next, open CharacterMap.js in a text editor:
- nano src/components/CharacterMap/CharacterMap.js
Import and use the TextContext component and use the show prop to display results as you did in the previous components:
import React, { useContext } from 'react';
import PropTypes from 'prop-types';
import { TextContext } from '../App/App';

export default function CharacterMap({ show }) {
  const text = useContext(TextContext);

  if(!show) {
    return null;
  }

  return(
    <div>
      Character Map: {text.length}
    </div>
  )
}

CharacterMap.proTypes = {
  show: PropTypes.bool.isRequired
}
This component will need a slightly more complicated function to create the frequency map for each letter. You’ll need to go through each character and increment a value anytime there is a repeat. Then you’ll need to take that data and sort it so that the most frequent letters are at the top of the list.
To do this, add the following highlighted code:
import React, { useContext } from 'react';
import PropTypes from 'prop-types';
import { TextContext } from '../App/App';

function itemize(text){
 const letters = text.split('')
   .filter(l => l !== ' ')
   .reduce((collection, item) => {
     const letter = item.toLowerCase();
     return {
       ...collection,
       [letter]: (collection[letter] || 0) + 1
     }
   }, {})
 return Object.entries(letters)
   .sort((a, b) => b[1] - a[1]);
}

export default function CharacterMap({ show }) {
  const text = useContext(TextContext);

  if(!show) {
    return null;
  }

  return(
    <div>
     Character Map:
     {itemize(text).map(character => (
       <div key={character[0]}>
         {character[0]}: {character[1]}
       </div>
     ))}
    </div>
  )
}

CharacterMap.proTypes = {
  show: PropTypes.bool.isRequired
}
In this code, you create a function called itemize that splits the text into an array of characters using the split() string method. Then you reduce the array to an object by adding the character and then incrementing the count for each subsequent character. Finally, you convert the object to an array of pairs using Object.entries and sort to put the most used characters at the top.
After you create the function, you pass the text to the function in the render method and map over the results to display the character—array value [0]—and the count—array value [1]—inside a <div>.
Save and close the file. This function will give you an opportunity to explore some performance features of the React Developer Tools in the next section.
Next, add the new components to TextInformation and look at the values in React Developer Tools.
Open TextInformation.js:
- nano src/components/TextInformation/TextInformation.js
Import and render the new components:
import React, { useReducer } from 'react';
import CharacterCount from '../CharacterCount/CharacterCount';
import CharacterMap from '../CharacterMap/CharacterMap';
import WordCount from '../WordCount/WordCount';

const reducer = (state, action) => {
  return {
    ...state,
    [action]: !state[action]
  }
}

export default function TextInformation() {
  const [tabs, toggleTabs] = useReducer(reducer, {
    characterCount: true,
    wordCount: true,
    characterMap: true
  });

  return(
    <div>
      <button onClick={() => toggleTabs('characterCount')}>Character Count</button>
      <button onClick={() => toggleTabs('wordCount')}>Word Count</button>
      <button onClick={() => toggleTabs('characterMap')}>Character Map</button>
      <CharacterCount show={tabs.characterCount} />
      <WordCount show={tabs.wordCount} />
      <CharacterMap show={tabs.characterMap} />
    </div>
  )
}
Save and close the file. When you do, the browser will refresh, and if you add in some data, you’ll find the character frequency analysis in the new components:
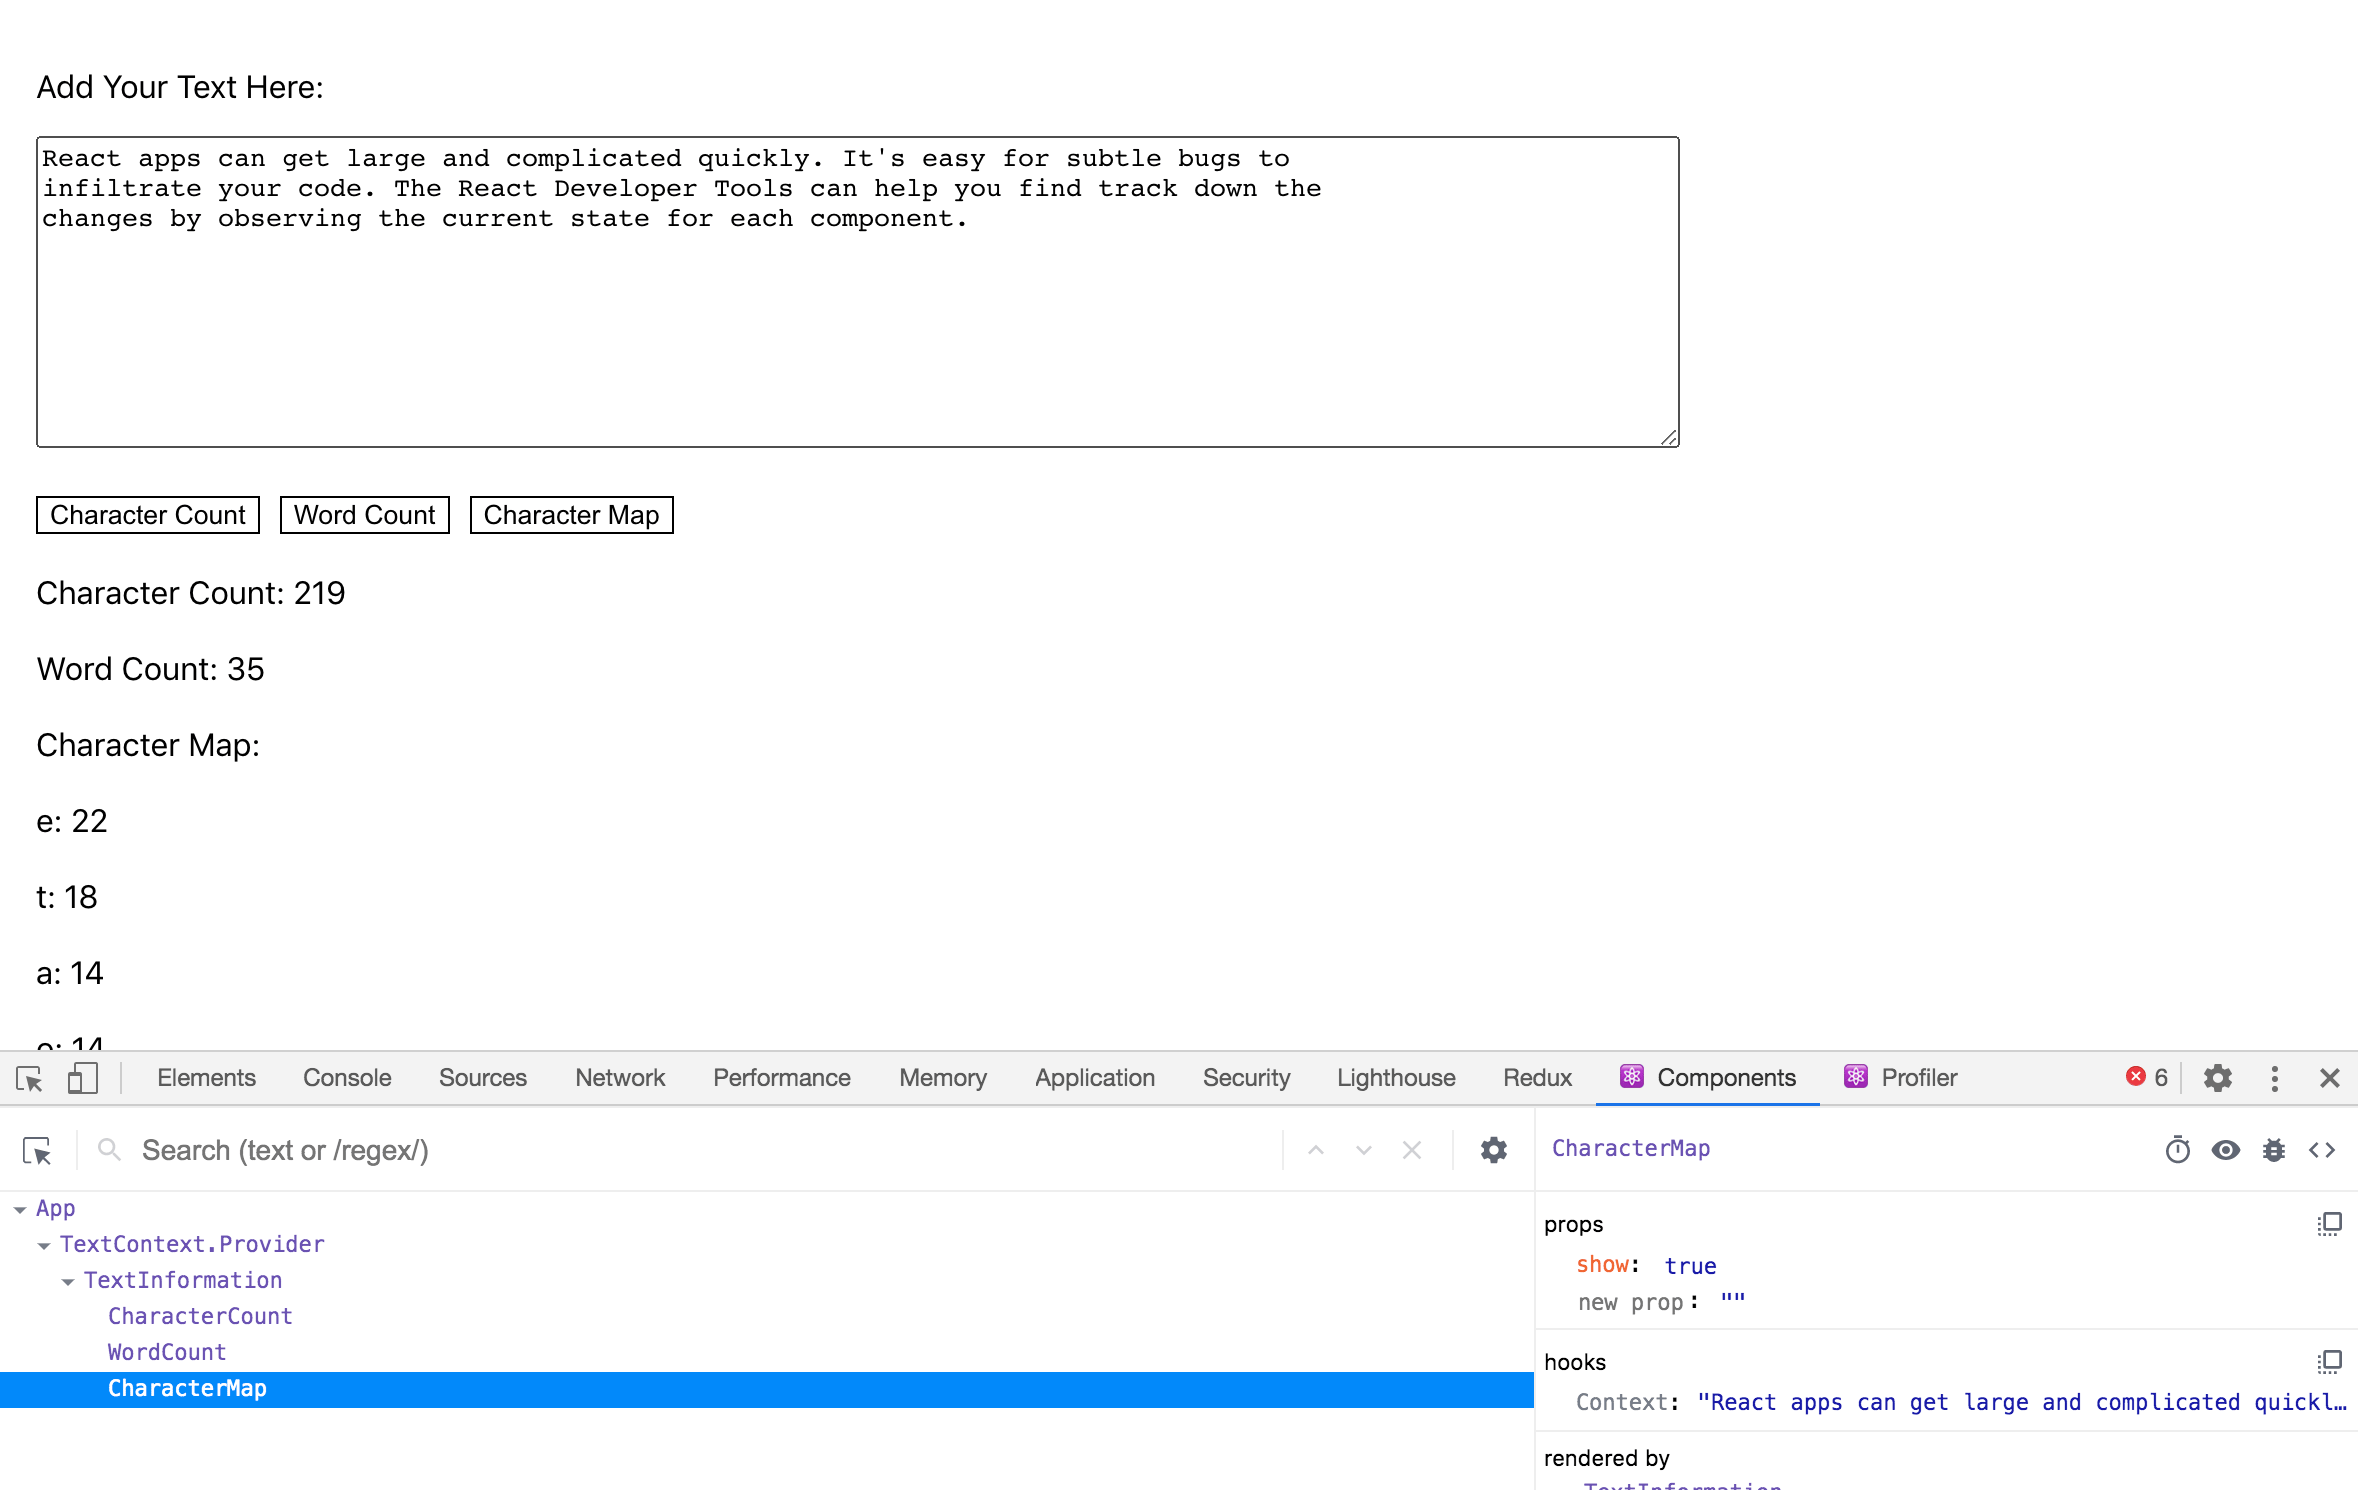
In this section, you used React Developer Tools to explore the component tree. You also learned how to see the real-time props for each component and how to manually change the props using the developer tools. Finally, you viewed the context for the component change with input.
In the next section, you’ll use the React Developer Tools Profiler tab to identify components that have long render times.
Step 3 — Tracking Component Rendering Across Interactions
In this step, you’ll use the React Developer Tools profiler to track component rendering and re-rendering as you use the sample application. You’ll navigate flamegraphs, or visualizations of your app’s relevant optimization metrics, and use the information to identify inefficient components, reduce rendering time, and increase application speed.
By the end of this step, you’ll know how to identify components that render during user interactions and how to compose components to reduce inefficient rendering.
A quick way to see how components change each other is to enable highlighting when a component is re-rendered. This will give you a visual overview of how the components respond to changing data.
In React Developer Tools, click on the Settings icon. It will look like a gear:
![]()
Then select the option under General that says Highlight updates when components render.
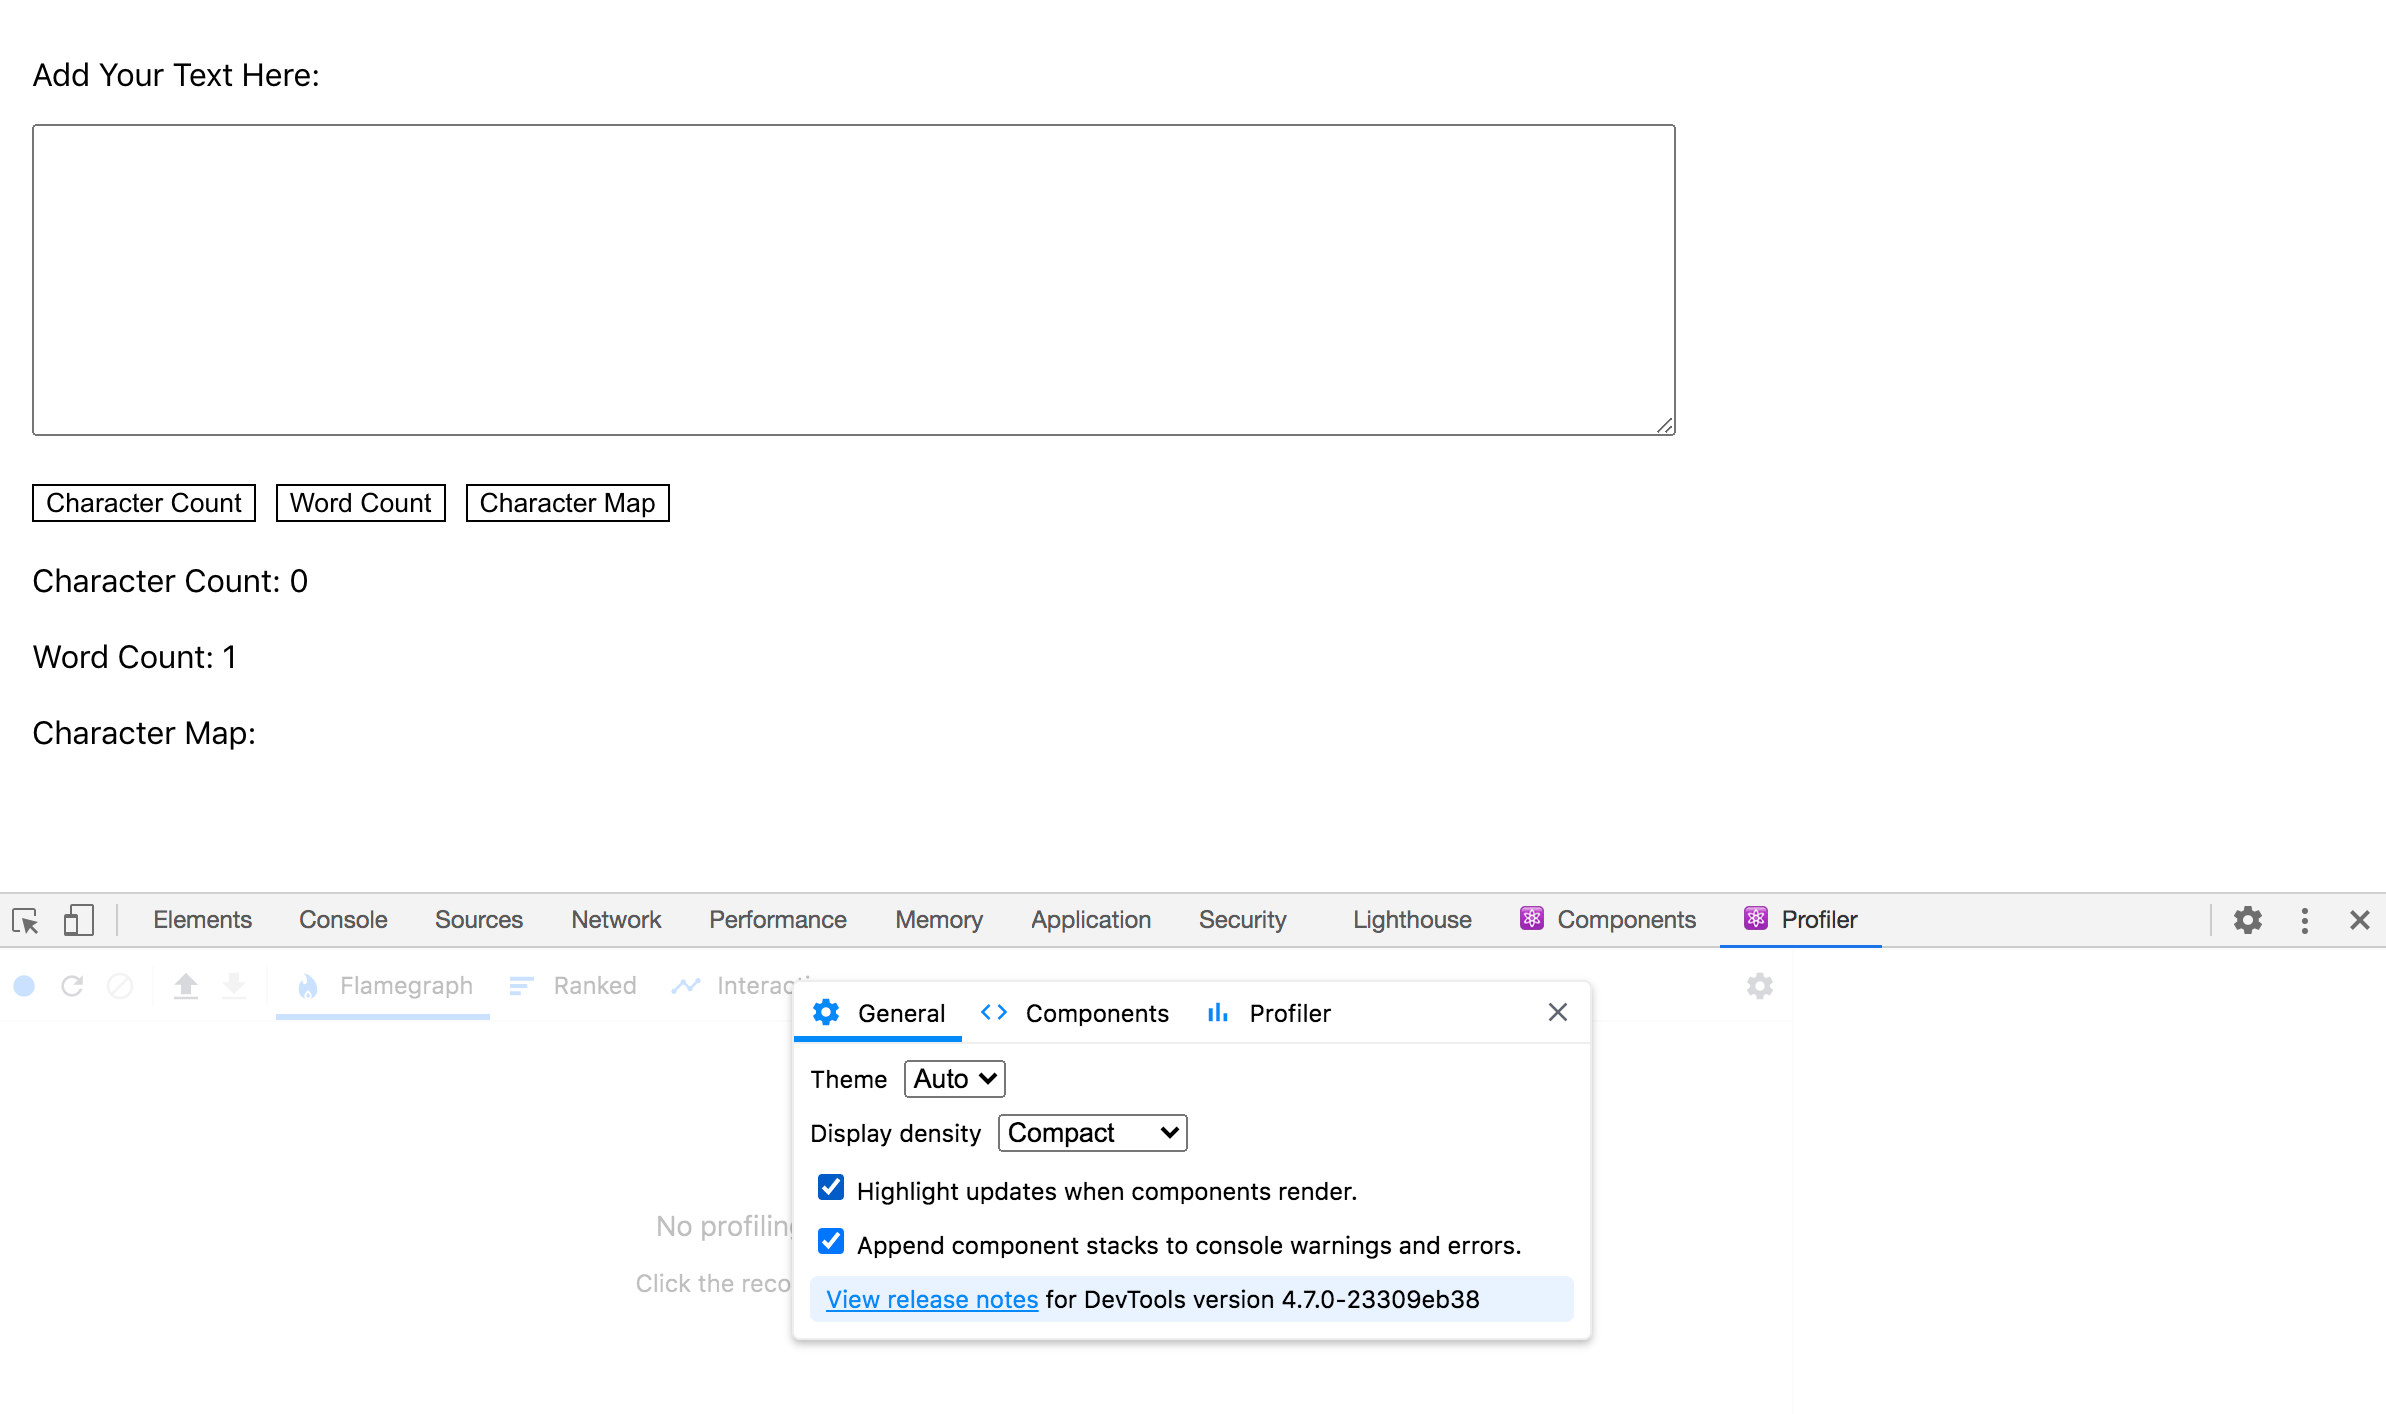
When you make any changes, React Developer Tools will highlight components that re-render. For example, when you change input, every component re-renders because the data is stored on a Hook at the root level and every change will re-render the whole component tree.
Notice the highlighting around the components, including the top of the screen around the root component:
Compare that to how the components re-render when you click on one of the buttons to toggle the data. If you click one of the buttons, the components under TextInformation will re-render, but not the root component:
Showing the re-renders will give you a quick idea of how the components are related, but it doesn’t give you a lot of data to analyze specific components. To gain more insight, let’s look at the profiler tools.
The profiler tools are designed to help you measure precisely how long each component takes to render. This can help you identify components that may be slow or process intense.
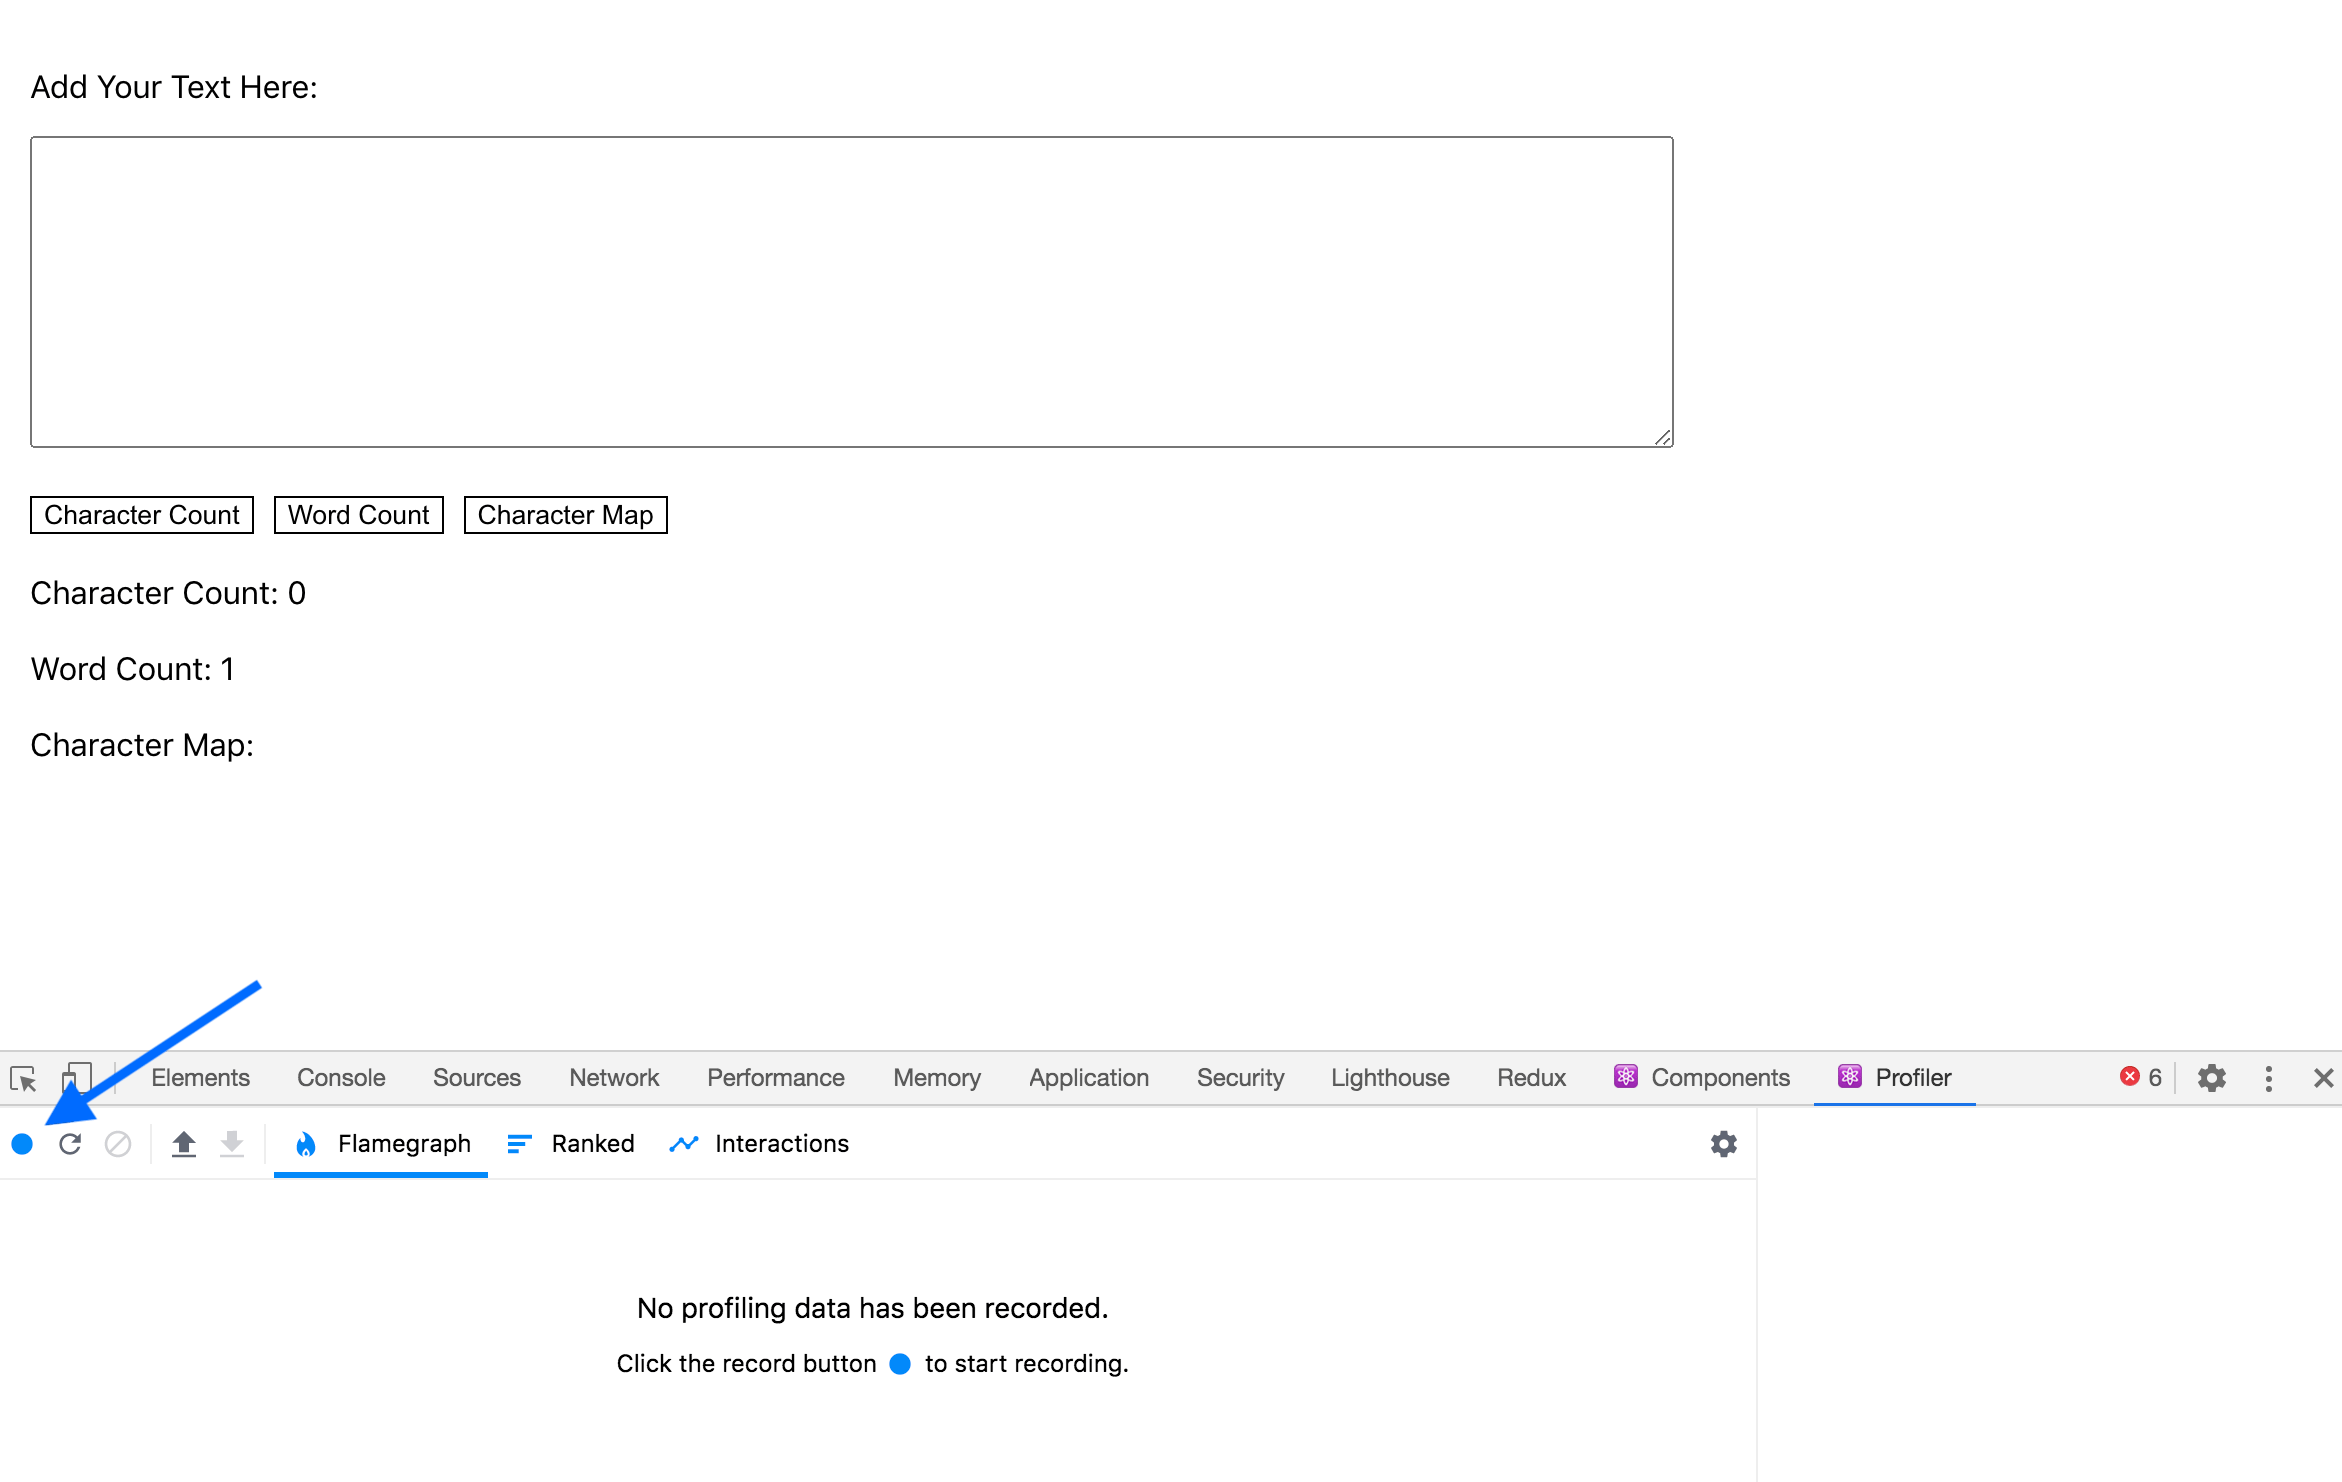
Re-open the settings and uncheck the box for Highlight updates when components render. Then click on the Profiler tab in the console.
To use the profiler, click the blue circle on the left of the screen to begin recording and click it again when you are finished:
When you stop recording, you’ll find a graph of the component changes including, how long each item took to render.
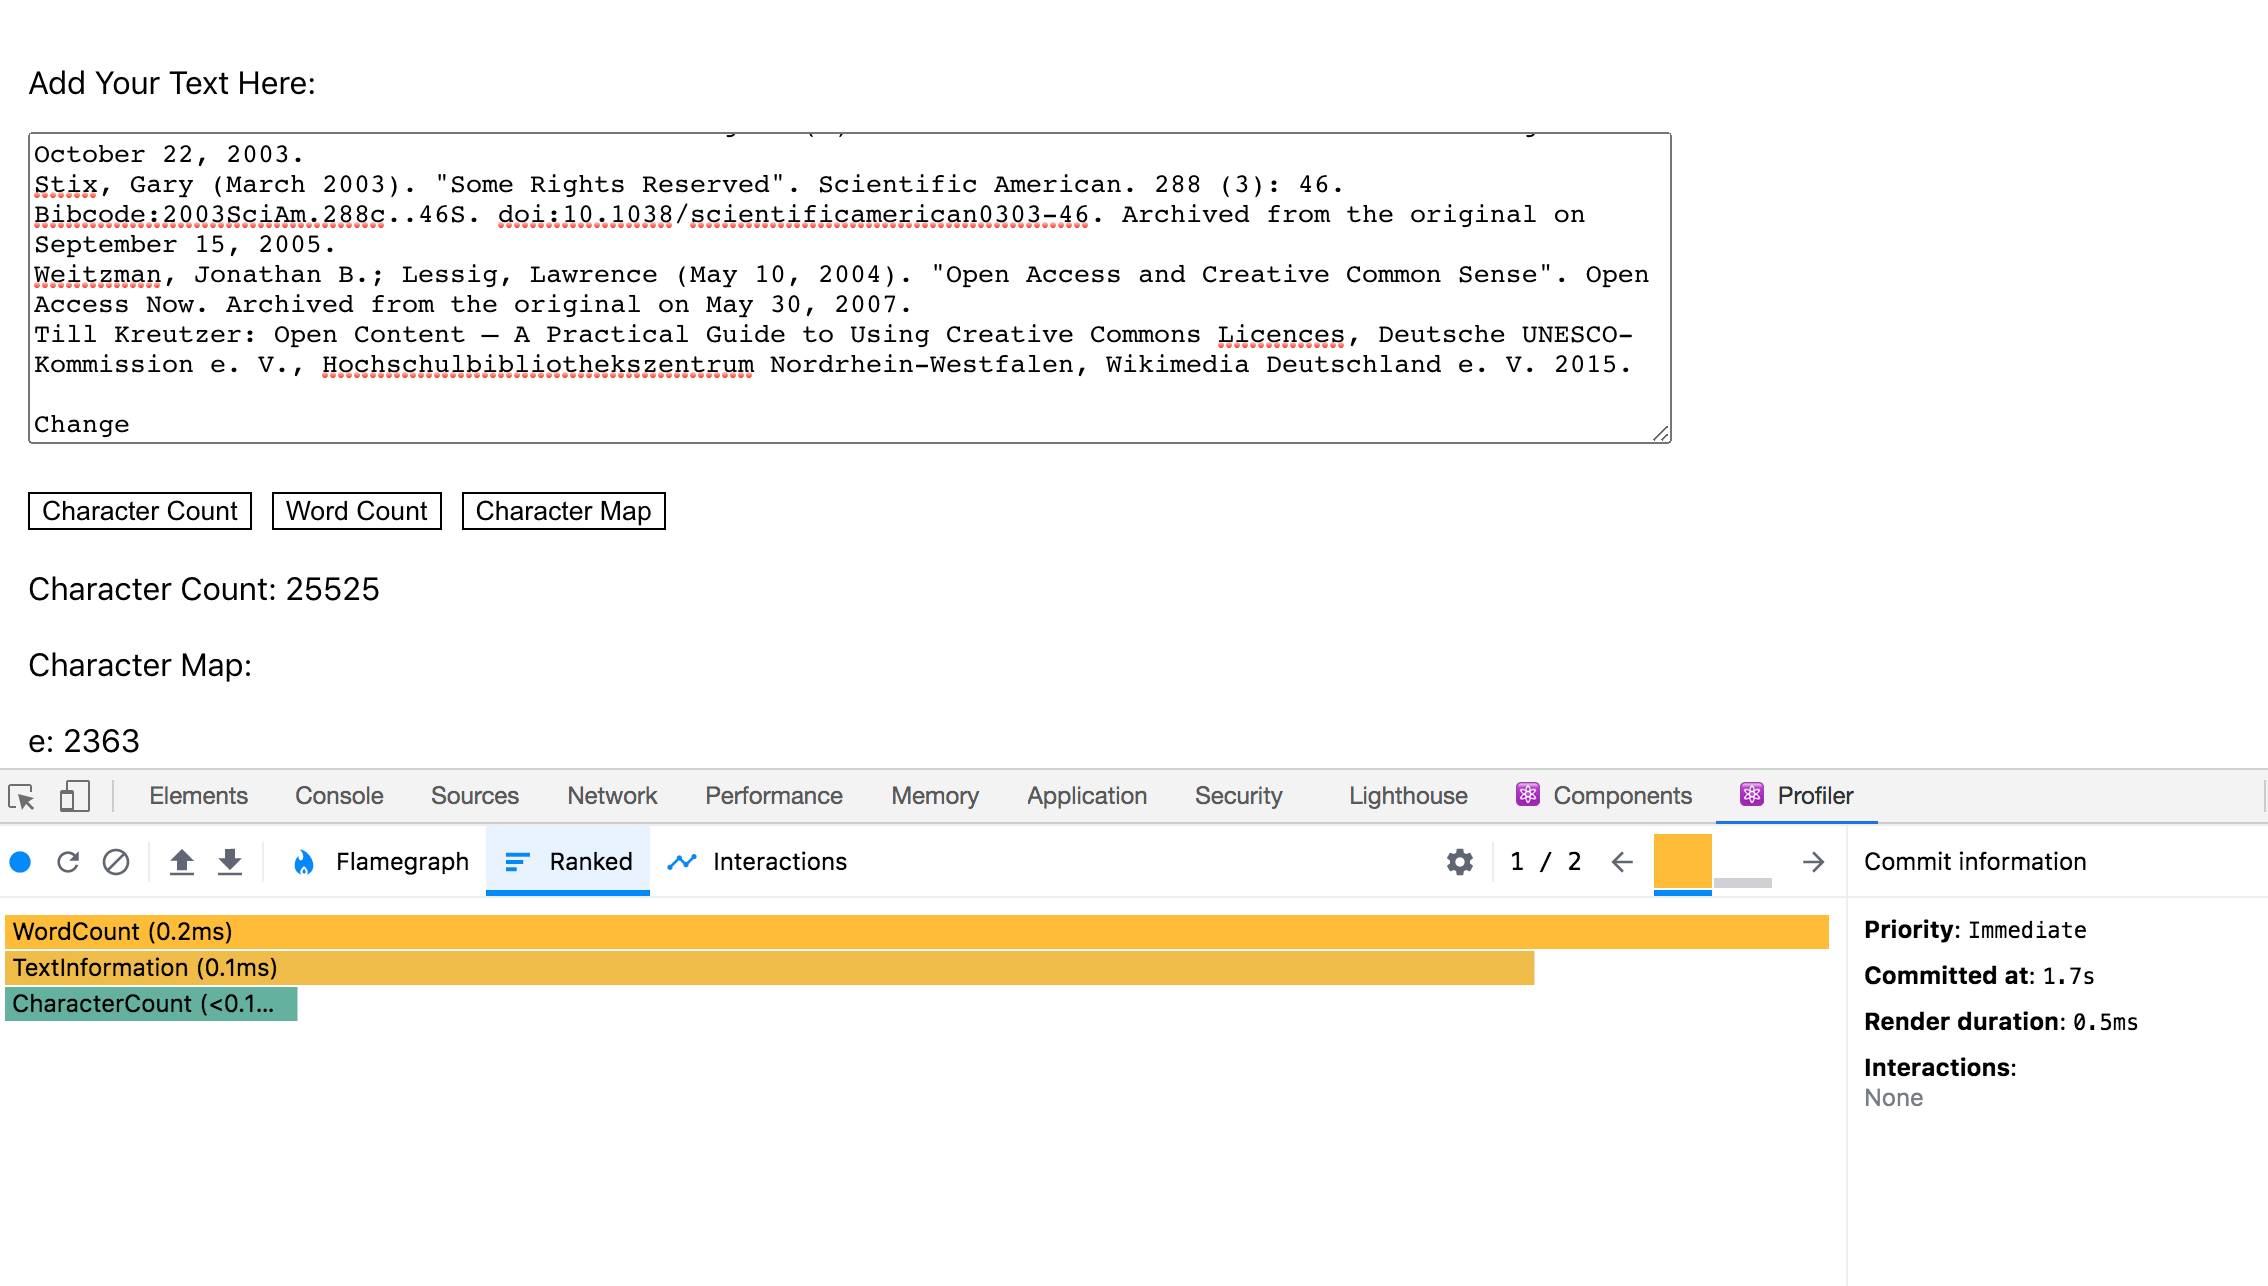
To get a good sense of the relative efficiency of the components, paste in the Wikipedia page for Creative Commons. This text is long enough to give interesting results, but not so big that it will crash the application.
After pasting in the text, start the profiler, then make a small change to the input. Stop profiling after the component has finished re-rendering. There will be a long pause, because the application is handling a long re-rendering:

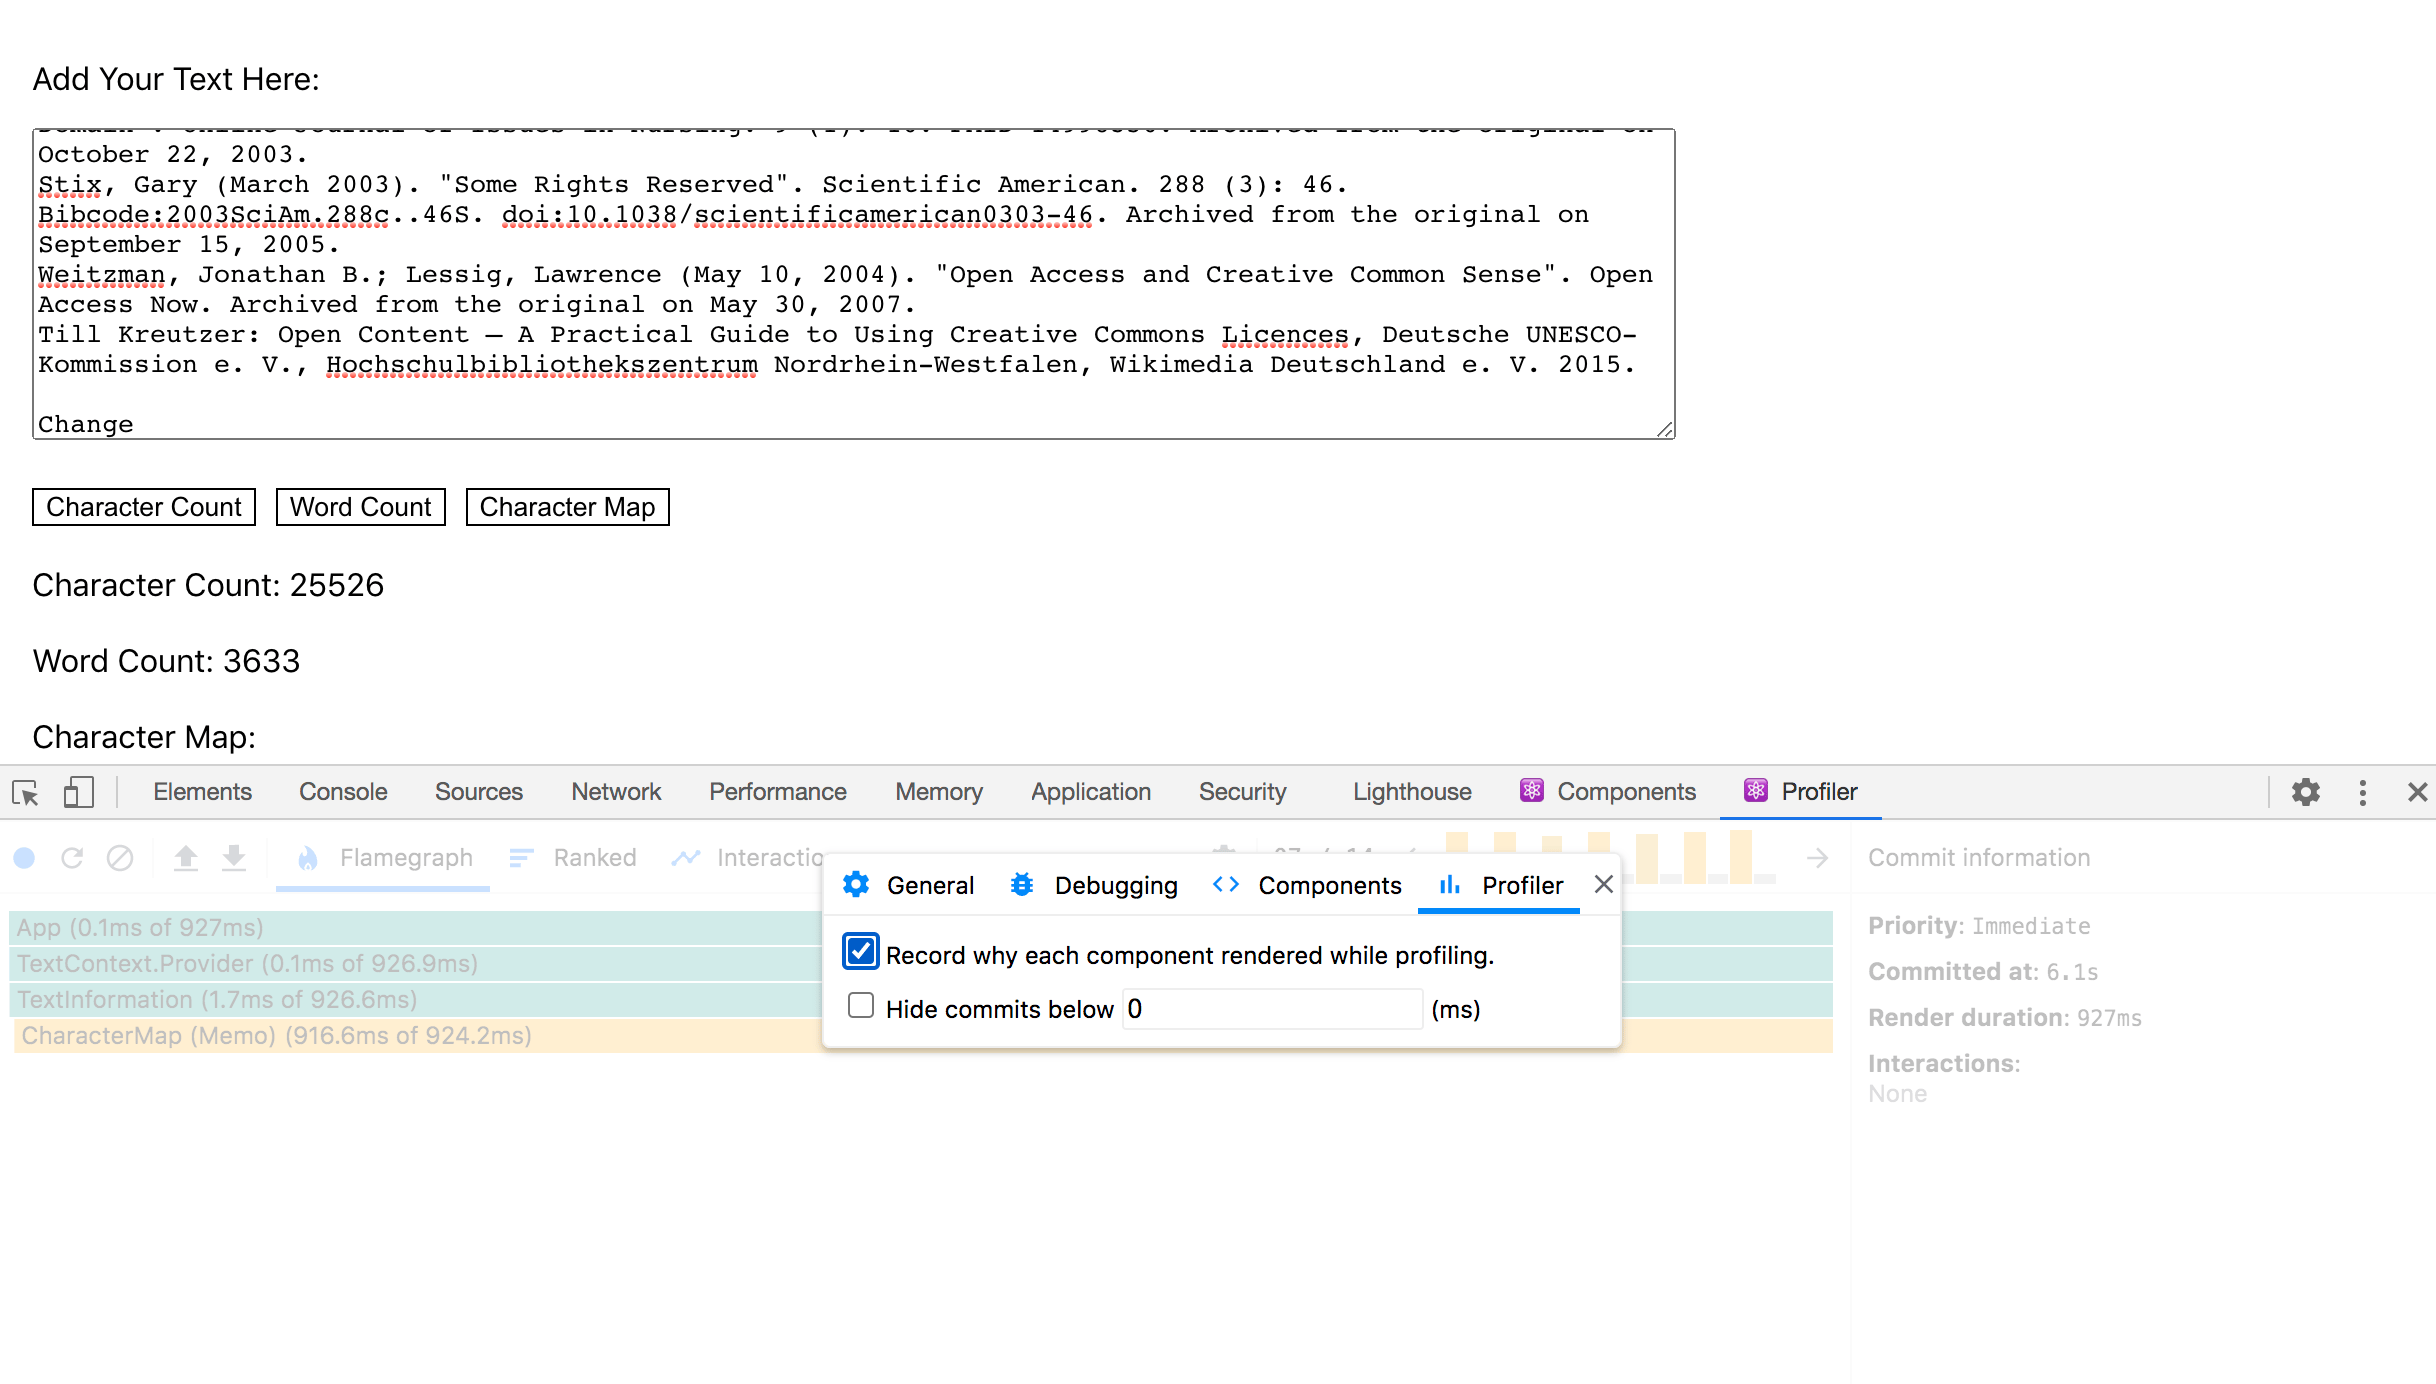
When you end the recording, React Developer Tools will create a flamegraph that shows every component that re-rendered and how long it took to re-render each component.
In this case, every keypress from the word “Change” causes a re-render. More importantly, it shows how long each render takes and why there was a long delay. The components App, TextContext.Provider, and TextInformation take about .2 milliseconds to rerender. But the CharacterMap component takes around 1 second per keystroke to re-render because of the complicated data parsing in the itemize function.
In the display, each yellow bar is a new keystroke. You can replay the sequence one at a time by clicking on each bar. Notice that there is slight variation in the render times, but the CharacterMap is consistently slow:
You can get more information by selecting the option Record why each component rendered while profiling. under the Profiler section of the settings.
Try toggling the Word Count component and notice how long the changes take. The application still lags even though you haven’t changed the text content:

Now when you hover your cursor over a component, you’ll find that it includes a reason the component re-rendered. In this case, the reason the component changed is The parent component rendered. That’s a problem for the CharacterMap component. CharacterMap is doing an expensive calculation every time the parent changes, even if the props and the context do not change. That is, it’s recalculating data even though the data is identical to the previous render.
Click on the Ranked tab and you’ll find how much more time CharacterMap takes when compared to all other components:
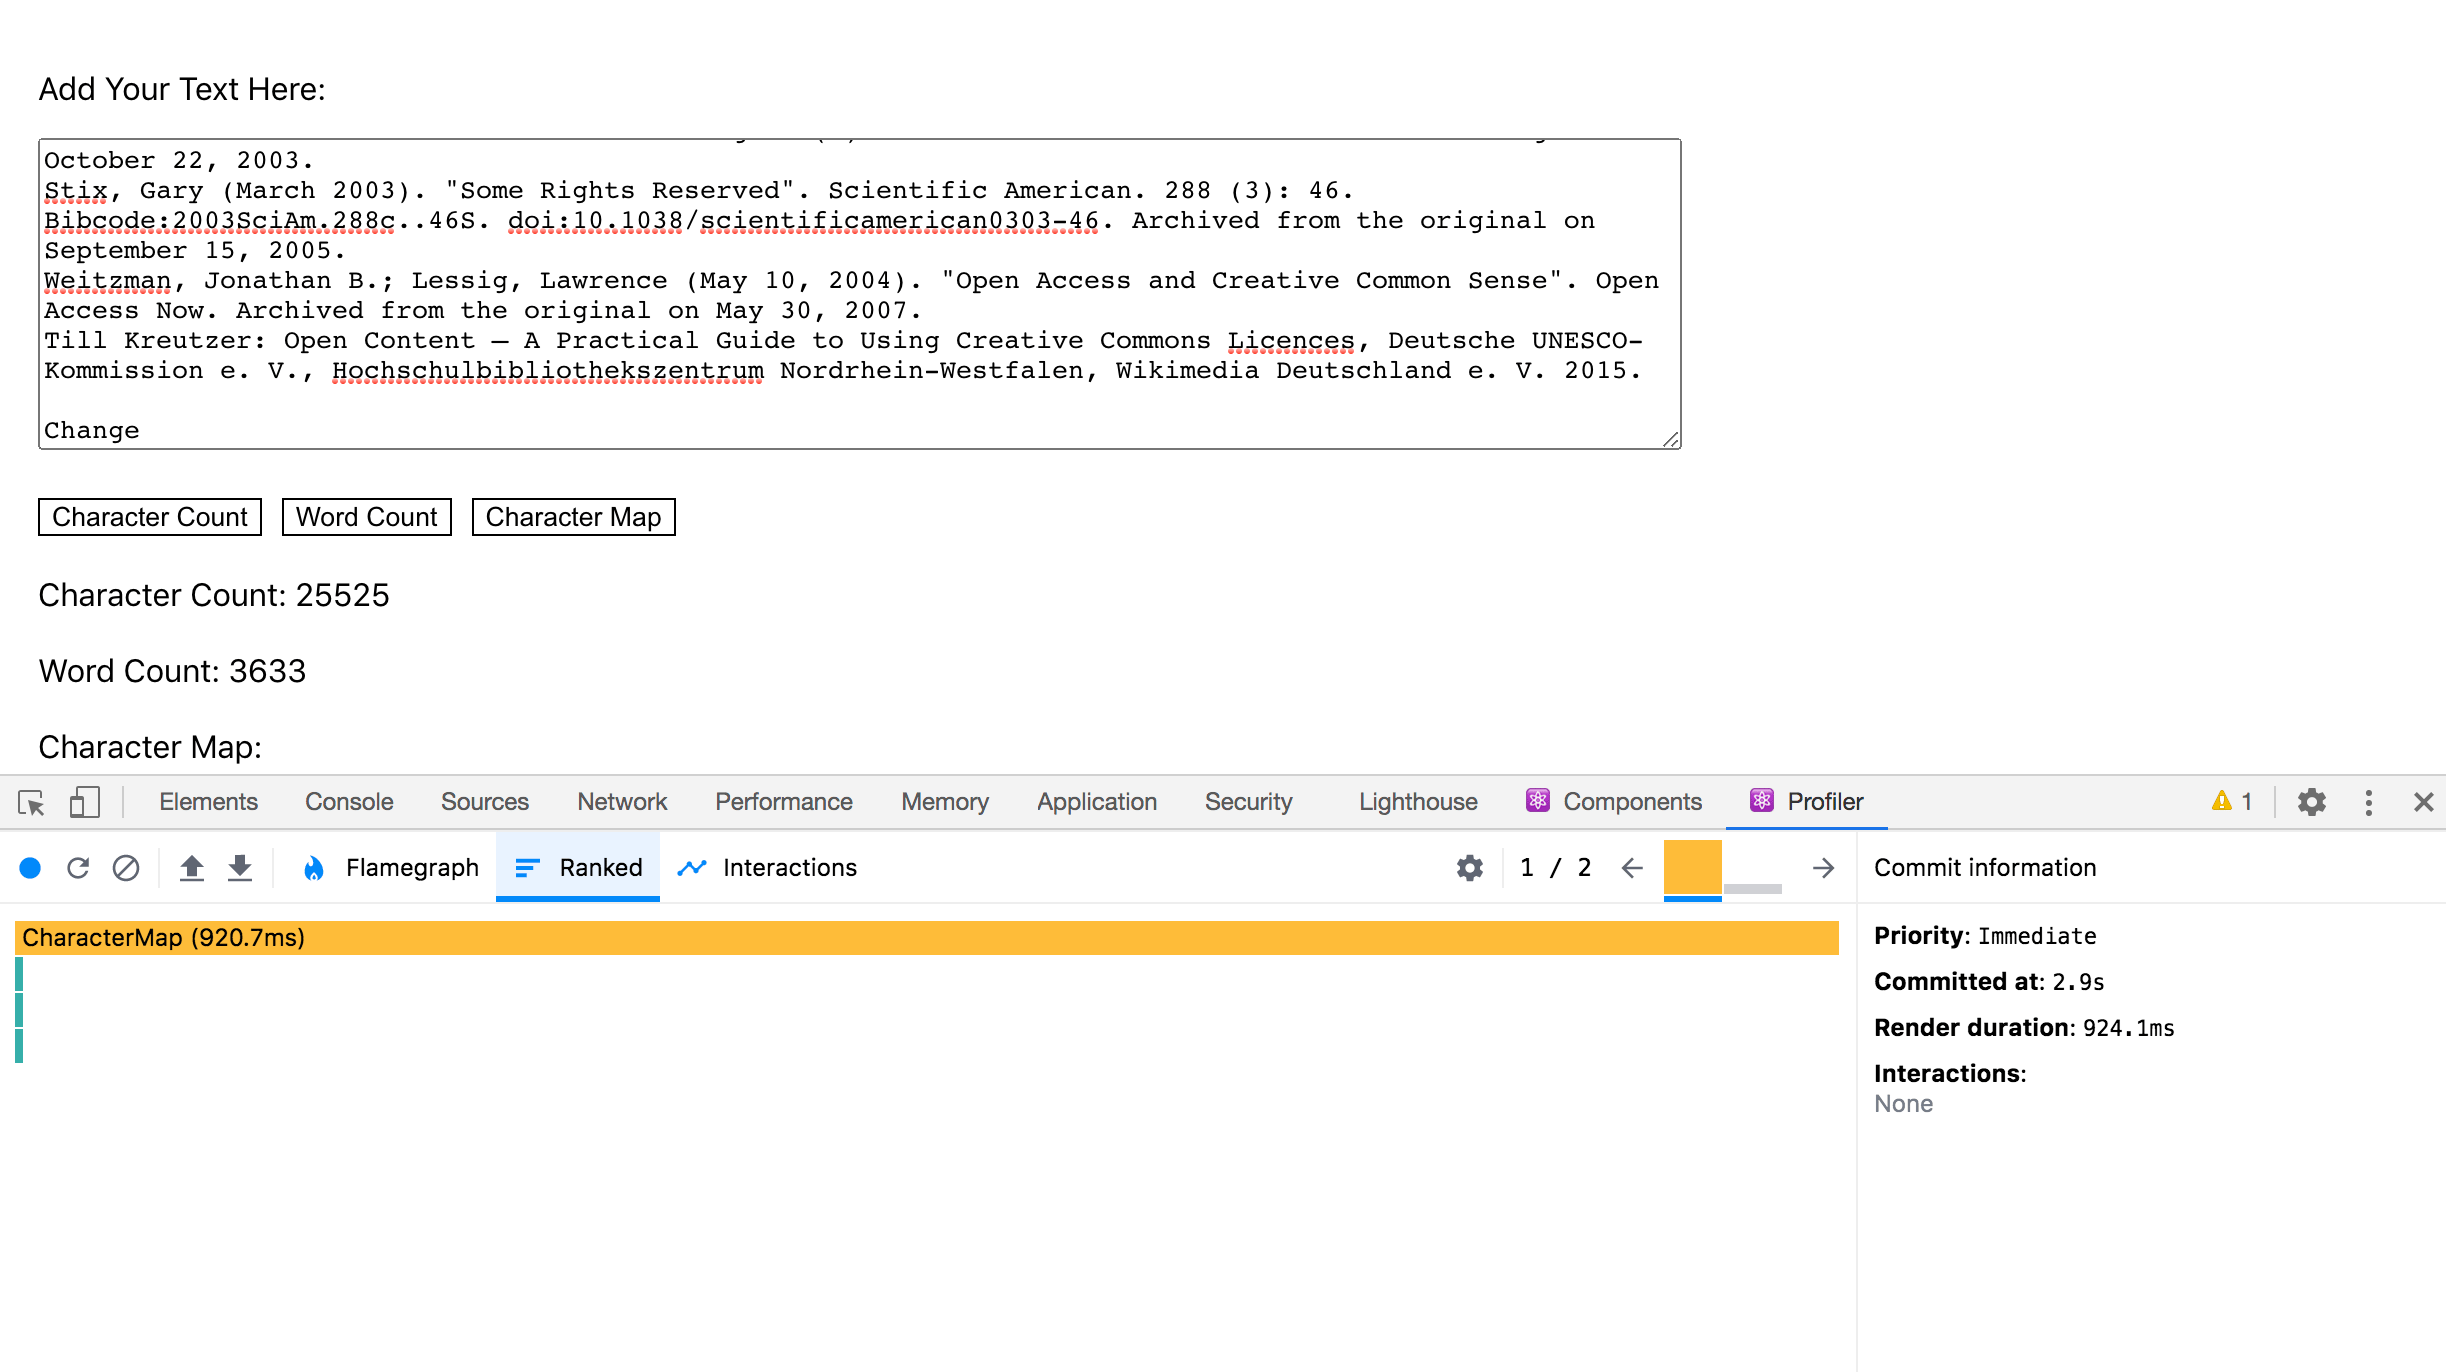
React Developer Tools have helped isolate a problem: the CharacterMap component re-renders and performs an expensive calculation anytime any parent component changes.
There are multiple ways to solve the problem, but they all involve some sort of caching via memoization, a process by which already calculated data is remembered rather than recalculated. You can either use a library like lodash/memoize or memoize-one to cache the results of the itemize function, or you can use the built in React memo function to memoize the whole component.
If you use the React memo, the function will only re-render if the props or context change. In this case, you’ll use React memo. In general, you should memoize the data itself first since it’s a more isolated case, but there are some interesting changes in the React Developer Tools if you memoize the whole component, so you’ll use that approach in this tutorial.
Open CharacterMap.js:
- nano src/components/CharacterMap/CharacterMap.js
Import memo from React, then pass the entire function into the memo function:
import React, { memo, useContext } from 'react';
import PropTypes from 'prop-types';
import { TextContext } from '../App/App';

...

function CharacterMap({ show }) {
  const text = useContext(TextContext);

  if(!show) {
    return null;
  }

  return(
    <div>
     Character Map:
     {itemize(text).map(character => (
       <div key={character[0]}>
         {character[0]}: {character[1]}
       </div>
     ))}
    </div>
  )
}

CharacterMap.proTypes = {
  show: PropTypes.bool.isRequired
}

export default memo(CharacterMap);
You move the export default line to the end of the code in order to pass the component to memo right before exporting. After that, React will compare the props before re-rendering.
Save and close the file. The browser will reload, and when you toggle the WordCount, the component will update much faster. This time, CharacterMap does not re-render. Instead, in React Developer Tools, you’ll see a gray rectangle showing re-rendering was prevented.
If you look at the Ranked tab, you’ll find that both the CharacterCount and the WordCount re-rendered, but for different reasons. Since CharacterCount is not memoized, it re-rendered because the parent changed. The WordCount re-rendered because the props changed. Even if it was wrapped in memo, it would still rerender.
Note: Memoizing is helpful, but you should only use it when you have a clear performance problem, as you did in this case. Otherwise, it can create a performance problem: React will have to check props every time it re-renders, which can cause a delay on smaller components.
In this step, you used the profiler to identify re-renders and componenent re-rendering. You also used flamegraphs and ranked graphs to identify components that are slow to re-render and then used the memo function to prevent re-rendering when there are no changes to the props or context.
Conclusion
The React Developer Tools browser extension gives you a powerful set of utilities to explore your components in their applications. With these tools, you’ll be able to explore a component’s state and identify bugs using real data without console statements or debuggers. You can also use the profiler to explore how components interact with each other, allowing you to identify and optimize components that have slow rendering in your full application. These tools are a crucial part of the development process and give you an opportunity to explore the components as part of an application and not just as static code.
If you would like to learn more about debugging JavaScript, see our article on How To Debug Node.js with the Built-In Debugger and Chrome DevTools. For more React tutorials, check out our React Topic page, or return to the How To Code in React.js series page.
Thanks for learning with the DigitalOcean Community. Check out our offerings for compute, storage, networking, and managed databases.
Tutorial Series: How To Code in React.js
React is a popular JavaScript framework for creating front-end applications, such as user interfaces that allow users to interact with programs. Originally created by Facebook, it has gained popularity by allowing developers to create fast applications using an intuitive programming paradigm that ties JavaScript with an HTML-like syntax known as JSX.
In this series, you will build out examples of React projects to gain an understanding of this framework, giving you the knowledge you need to pursue front-end web development or start out on your way to full stack development.
Browse Series: 21 tutorials
About the author(s)
Author of Simplifying JavaScript. Writing featured in Slate, FreeCodeCamp, and here! I like to break things and put them back together. 🛠
Former Senior Technical Editor at DigitalOcean, fiction writer and podcaster elsewhere, always searching for the next good nautical pun! Areas of expertise include Node.js, PostgreSQL, CSS, JavaScript.
Still looking for an answer?
This textbox defaults to using Markdown to format your answer.
You can type !ref in this text area to quickly search our full set of tutorials, documentation & marketplace offerings and insert the link!
 This work is licensed under a Creative Commons Attribution-NonCommercial- ShareAlike 4.0 International License.
Become a contributor for community
Get paid to write technical tutorials and select a tech-focused charity to receive a matching donation.

DigitalOcean Documentation
Full documentation for every DigitalOcean product.

Resources for startups and AI-native businesses
The Wave has everything you need to know about building a business, from raising funding to marketing your product.
The developer cloud
Scale up as you grow — whether you're running one virtual machine or ten thousand.

Start building today
From GPU-powered inference and Kubernetes to managed databases and storage, get everything you need to build, scale, and deploy intelligent applications.
